
Compare Windsor Machines with Similar Stocks
Dashboard
Weak Long Term Fundamental Strength with a -7.60% CAGR growth in Operating Profits over the last 5 years
- Company's ability to service its debt is weak with a poor EBIT to Interest (avg) ratio of 1.21
- The company has been able to generate a Return on Equity (avg) of 0.69% signifying low profitability per unit of shareholders funds
With ROCE of 1.9, it has a Very Expensive valuation with a 5.4 Enterprise value to Capital Employed
48.78% of Promoter Shares are Pledged
Underperformed the market in the last 1 year
Stock DNA
Industrial Manufacturing
INR 2,915 Cr (Small Cap)
586.00
35
0.00%
0.11
1.00%
5.85
Total Returns (Price + Dividend) 
Latest dividend: 0.5 per share ex-dividend date: Aug-27-2024
Risk Adjusted Returns v/s
Returns Beta

News

Windsor Machines Ltd is Rated Sell by MarketsMOJO
Windsor Machines Ltd is rated Sell by MarketsMOJO, with this rating last updated on 30 June 2026. However, the analysis and financial metrics discussed here reflect the stock's current position as of 03 August 2026, providing investors with the latest insights into the company’s performance and outlook.
Read full news article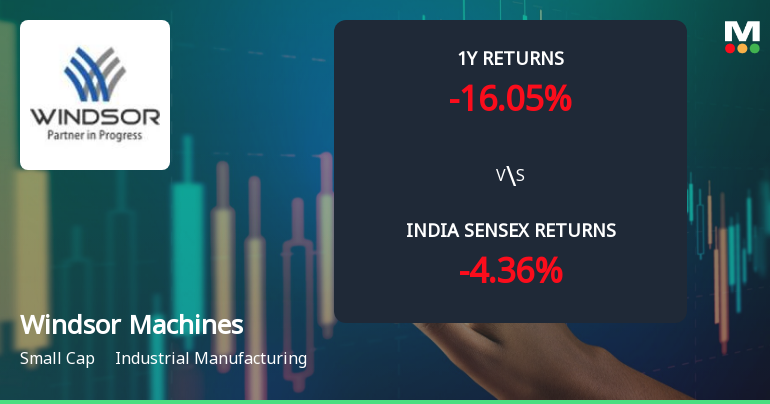
Windsor Machines Ltd Technical Momentum Shifts Amid Bearish Signals
Windsor Machines Ltd, a small-cap player in the industrial manufacturing sector, has experienced a notable shift in its technical momentum, moving from a mildly bullish to a mildly bearish stance. Despite a modest year-to-date gain, recent technical indicators including MACD, Bollinger Bands, and moving averages suggest caution for investors as the stock price retraces from recent highs.
Read full news article
Windsor Machines Ltd Technical Momentum Shifts Amid Mixed Market Signals
Windsor Machines Ltd, a small-cap player in the industrial manufacturing sector, has recently exhibited a subtle shift in its technical momentum, moving from a mildly bearish stance to a mildly bullish one. Despite a modest day gain of 2.46%, the stock’s technical indicators present a nuanced picture, with some metrics signalling caution while others suggest potential upside. This article analyses the latest technical parameters, price momentum, and relative performance against the Sensex to provide a comprehensive view for investors.
Read full news article Announcements
Board Meeting Outcome for Outcome Of The Meeting Of Board Of Directors Held On July 15 2026
15-Jul-2026 | Source : BSEPlease find enclosed the outcome of the meeting of Board of Directors held on July 15 2026
Announcement under Regulation 30 (LODR)-Change in Management
15-Jul-2026 | Source : BSEPlease find enclosed the intimation for change in Key Managerial Personnel pursuant to the SEBI LODR Regulations
Compliances-Certificate under Reg. 74 (5) of SEBI (DP) Regulations 2018
08-Jul-2026 | Source : BSEPlease find enclosed the confirmation certificate under SEBI DP Regulations
Corporate Actions

No Upcoming Board Meetings

Windsor Machines Ltd has declared 25% dividend, ex-date: 27 Aug 24

Windsor Machines Ltd has announced 2:4 stock split, ex-date: 16 Jun 11

No Bonus history available

No Rights history available
Quality key factors
Valuation key factors
Technicals key factors
 Technical Indicator Scale: Bearish, Mildly Bearish, Sideways, Mildly Bullish, Bullish Turned
 Shareholding Snapshot : Jun 2026
Shareholding Compare (%holding)
Non Institution
48.7758
Held by 2 Schemes (0.01%)
Held by 13 FIIs (2.31%)
Plutus Investments And Holding Private Limited (34.41%)
Vinit Dharamshibhai Bediya (10.25%)
31.45%
Quarterly Results Snapshot (Consolidated) - Mar'26 - YoY

YoY Growth in quarter ended Mar 2026 is 52.82% vs 10.46% in Mar 2025
YoY Growth in quarter ended Mar 2026 is 274.88% vs 44.58% in Mar 2025
Half Yearly Results Snapshot (Consolidated) - Sep'25
Growth in half year ended Sep 2025 is 78.23% vs -11.40% in Sep 2024
Growth in half year ended Sep 2025 is 79.25% vs -1,485.26% in Sep 2024
Nine Monthly Results Snapshot (Consolidated) - Dec'25
YoY Growth in nine months ended Dec 2025 is 55.63% vs 1.05% in Dec 2024

YoY Growth in nine months ended Dec 2025 is -177.77% vs 5,126.09% in Dec 2024
Annual Results Snapshot (Consolidated) - Mar'26
YoY Growth in year ended Mar 2026 is 54.72% vs 4.17% in Mar 2025
YoY Growth in year ended Mar 2026 is -91.37% vs 196.36% in Mar 2025
About Windsor Machines Ltd

Company Coordinates


