
Compare Yatharth Hospit. with Similar Stocks
Dashboard
Poor Management Efficiency with a low ROE of 9.01%
- The company has been able to generate a Return on Equity (avg) of 9.01% signifying low profitability per unit of shareholders funds
The company is Net-Debt Free
Healthy long term growth as Net Sales has grown by an annual rate of 32.09%
The company has declared Positive results for the last 11 consecutive quarters
With ROE of 9.9, it has a Expensive valuation with a 4.5 Price to Book Value
Majority shareholders : Promoters
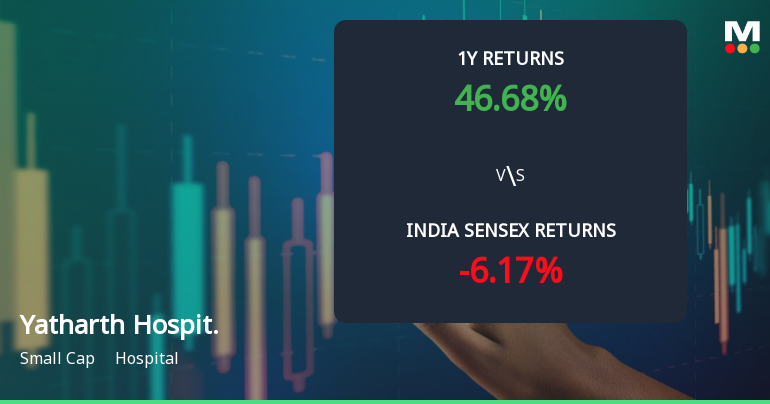
Market Beating Performance
Total Returns (Price + Dividend) 
Yatharth Hospit. for the last several years.
Risk Adjusted Returns v/s
Returns Beta

News
Yatharth Hospital & Trauma Care Services Ltd: Technical Momentum Shifts Amid Mixed Signals
Yatharth Hospital & Trauma Care Services Ltd has experienced a nuanced shift in its technical parameters, reflecting a complex interplay of bullish and bearish signals. Despite a recent downgrade in daily price momentum, the stock’s year-to-date returns remain robust, outperforming the Sensex significantly. This article analyses the latest technical indicators, price movements, and market context to provide a comprehensive view of the stock’s current positioning.
Read full news article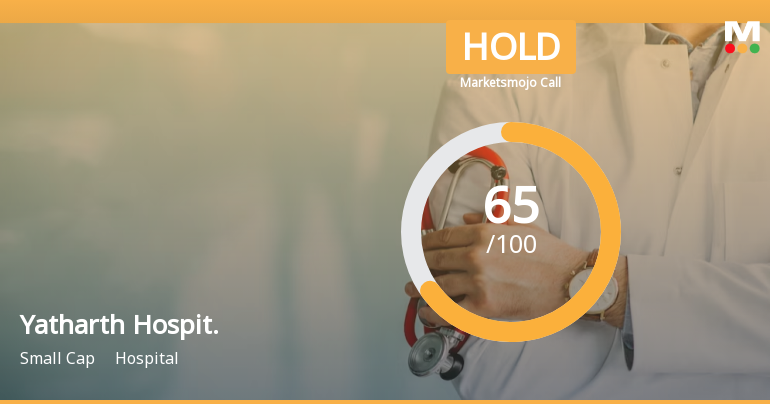
Yatharth Hospital & Trauma Care Services Ltd is Rated Hold
Yatharth Hospital & Trauma Care Services Ltd is rated 'Hold' by MarketsMOJO, with this rating last updated on 10 April 2026. However, the analysis and financial metrics discussed here reflect the company’s current position as of 30 June 2026, providing investors with the latest insights into its performance and outlook.
Read full news article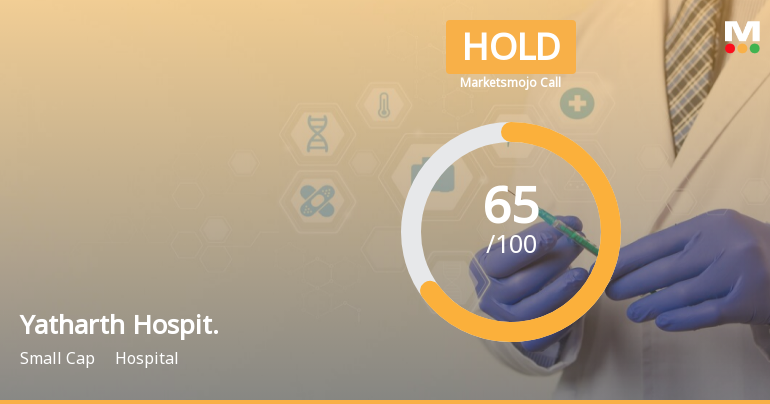
Yatharth Hospital & Trauma Care Services Ltd is Rated Hold
Yatharth Hospital & Trauma Care Services Ltd is rated 'Hold' by MarketsMOJO, with this rating last updated on 10 April 2026. However, the analysis and financial metrics discussed here reflect the company’s current position as of 19 June 2026, providing investors with an up-to-date view of its performance and prospects.
Read full news article Announcements
Corporate Actions

No Upcoming Board Meetings

No Dividend history available

No Splits history available

No Bonus history available

No Rights history available
Quality key factors
Valuation key factors
Technicals key factors
 Technical Indicator Scale: Bearish, Mildly Bearish, Sideways, Mildly Bullish, Bullish Turned
 Shareholding Snapshot : Mar 2026
Shareholding Compare (%holding)
Promoters
10.7343
Held by 7 Schemes (9.37%)
Held by 58 FIIs (5.25%)
Ajay Kumar Tyagi (30.59%)
Kotak Mahindra Trustee Co Ltd A/c Kotak Multicap Fund (4.89%)
20.47%
Quarterly Results Snapshot (Consolidated) - Mar'26 - QoQ

QoQ Growth in quarter ended Mar 2026 is 6.58% vs 14.69% in Dec 2025
QoQ Growth in quarter ended Mar 2026 is 4.79% vs 9.97% in Dec 2025
Half Yearly Results Snapshot (Consolidated) - Sep'25
Growth in half year ended Sep 2025 is 25.06% vs 31.85% in Sep 2024

Growth in half year ended Sep 2025 is 35.77% vs 31.52% in Sep 2024
Nine Monthly Results Snapshot (Consolidated) - Dec'25
YoY Growth in nine months ended Dec 2025 is 32.21% vs 31.70% in Dec 2024
YoY Growth in nine months ended Dec 2025 is 40.07% vs 20.62% in Dec 2024
Annual Results Snapshot (Consolidated) - Mar'26
YoY Growth in year ended Mar 2026 is 37.10% vs 31.31% in Mar 2025
YoY Growth in year ended Mar 2026 is 34.34% vs 14.04% in Mar 2025
About Yatharth Hospital & Trauma Care Services Ltd

Company Coordinates


