
Compare T B Z with Similar Stocks
Dashboard
Healthy long term growth as Operating profit has grown by an annual rate 28.33%
With a growth in Net Profit of 612.75%, the company declared Very Positive results in Mar 26
With ROCE of 20.4, it has a Very Attractive valuation with a 1.6 Enterprise value to Capital Employed
Increasing Participation by Institutional Investors
Consistent Returns over the last 3 years
Stock DNA
Gems, Jewellery And Watches
INR 1,741 Cr (Micro Cap)
9.00
53
0.85%
0.94
24.14%
2.06
Total Returns (Price + Dividend) 
Latest dividend: 2.2 per share ex-dividend date: Sep-02-2025
Risk Adjusted Returns v/s
Returns Beta

News
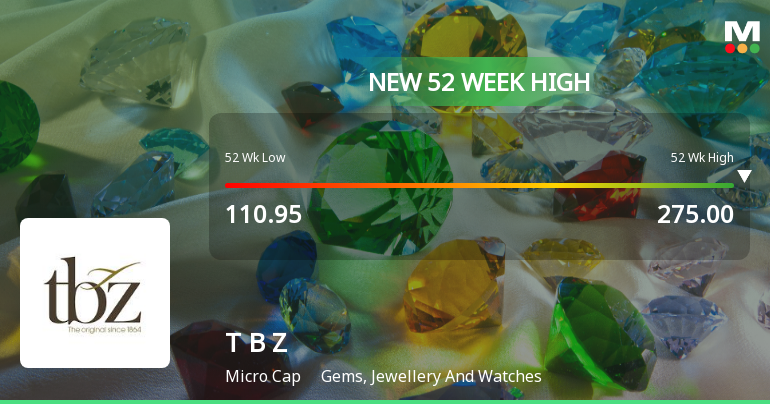
Broad-Based Technical Strength Lifts Tribhovandas Bhimji Zaveri Ltd to 52-Week High of Rs 270.65
With a decisive intraday surge pushing the price to Rs 270.65 on 27 Jul 2026, Tribhovandas Bhimji Zaveri Ltd has reached a fresh 52-week high, underscoring a sustained momentum that has outpaced the broader market and its sector peers.
Read full news article
Tribhovandas Bhimji Zaveri Ltd is Rated Strong Buy
Tribhovandas Bhimji Zaveri Ltd is rated Strong Buy by MarketsMOJO, with this rating last updated on 08 July 2026. However, the analysis and financial metrics discussed here reflect the company’s current position as of 20 July 2026, providing investors with the most up-to-date insight into the stock’s fundamentals, valuation, financial trends, and technical outlook.
Read full news article
Broad-Based Technical Strength Lifts Tribhovandas Bhimji Zaveri Ltd to 52-Week High of Rs 266.95
With a decisive break above Rs 266.95 on 15 Jul 2026, Tribhovandas Bhimji Zaveri Ltd has reached a fresh 52-week high, extending its impressive 33.24% gain over the past year. This milestone reflects a confluence of strong technical momentum and robust earnings growth, setting the stock apart in the Gems, Jewellery And Watches sector.
Read full news article Announcements
Clarification Sought from Tribhovandas Bhimji Zaveri Ltd
08-Jul-2026 | Source : BSEThe Exchange has sought clarification from Tribhovandas Bhimji Zaveri Ltd on July 8 2026 with reference to Movement in Volume.
The reply is awaited.
Clarification Letter For Significant Increase In Volume
08-Jul-2026 | Source : BSEClarification Letter for Significant Increase in Volume
Announcement under Regulation 30 (LODR)-Change in Management
07-Jul-2026 | Source : BSEMr. Sanjay Bilimoria Head - Inventory (Gold) has resigned from the services of the Company
Corporate Actions

No Upcoming Board Meetings

Tribhovandas Bhimji Zaveri Ltd has declared 22% dividend, ex-date: 02 Sep 25

No Splits history available

No Bonus history available

No Rights history available
Quality key factors
Valuation key factors
Technicals key factors
 Technical Indicator Scale: Bearish, Mildly Bearish, Sideways, Mildly Bullish, Bullish Turned
 Shareholding Snapshot : Jun 2026
Shareholding Compare (%holding)
Promoters
None
Held by 0 Schemes
Held by 4 FIIs (1.47%)
Shrikant Gopaldas Zaveri (50.06%)
Vijaykumar Chhotabhai Kalidas Patel (1.03%)
20.58%
Quarterly Results Snapshot (Consolidated) - Mar'26 - YoY

YoY Growth in quarter ended Mar 2026 is 56.74% vs 4.51% in Mar 2025
YoY Growth in quarter ended Mar 2026 is 612.75% vs -24.74% in Mar 2025
Half Yearly Results Snapshot (Consolidated) - Sep'25
Growth in half year ended Sep 2025 is 12.77% vs 10.64% in Sep 2024
Growth in half year ended Sep 2025 is 86.18% vs 42.39% in Sep 2024
Nine Monthly Results Snapshot (Consolidated) - Dec'25

YoY Growth in nine months ended Dec 2025 is 13.49% vs 16.67% in Dec 2024
YoY Growth in nine months ended Dec 2025 is 128.62% vs 40.84% in Dec 2024
Annual Results Snapshot (Consolidated) - Mar'26
YoY Growth in year ended Mar 2026 is 22.23% vs 13.99% in Mar 2025
YoY Growth in year ended Mar 2026 is 195.82% vs 25.65% in Mar 2025
About Tribhovandas Bhimji Zaveri Ltd

Company Coordinates


