
Compare Bandhan Bank with Similar Stocks
Dashboard
High Management Efficiency with a high ROA of 1.73%
The Bank has a high Capital Adequacy Ratio of 17.32% signifying high buffers against its risk based assets
Poor long term growth as Net profit has grown by an annual rate of -11.12%
Flat results in Mar 26
With ROA of 0.6, it has a Expensive valuation with a 1.3 Price to Book Value
Reducing Promoter Confidence
Market Beating Performance
Total Returns (Price + Dividend) 
Latest dividend: 1.5022992029429796 per share ex-dividend date: Aug-14-2025
Risk Adjusted Returns v/s
Returns Beta

News

Bandhan Bank Ltd. is Rated Hold
Bandhan Bank Ltd. is rated 'Hold' by MarketsMOJO, with this rating last updated on 04 May 2026. However, the analysis and financial metrics discussed here reflect the stock’s current position as of 19 June 2026, providing investors with an up-to-date perspective on the company’s performance and outlook.
Read full news article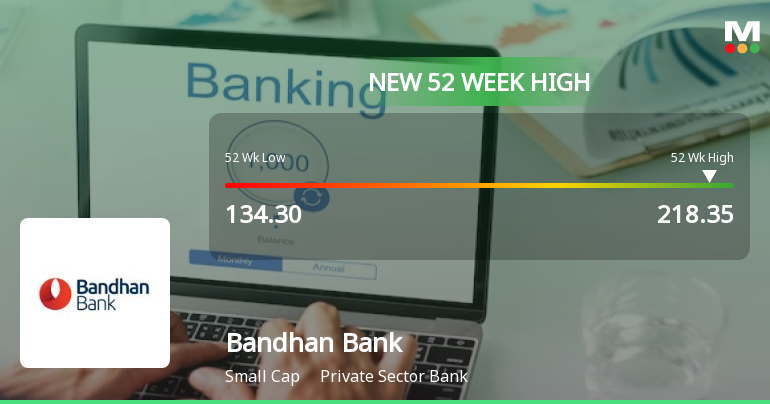
Broad-Based Technical Strength Lifts Bandhan Bank Ltd. to 52-Week High of Rs 218.35
With a decisive breakthrough to Rs 218.35 on 17 Jun 2026, Bandhan Bank Ltd. has reached a fresh 52-week high, extending its impressive 22.51% gain over the past year against the Sensex’s decline of 5.54%. This milestone reflects a strong alignment of technical indicators and sustained price momentum despite a minor pullback today.
Read full news article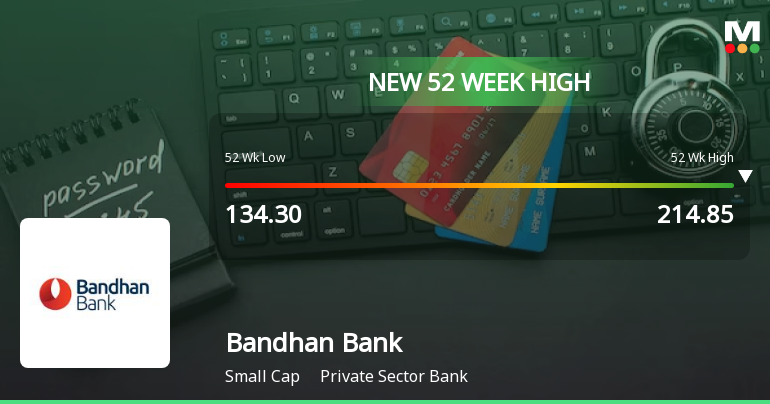
Broad-Based Technical Strength Lifts Bandhan Bank Ltd. to 52-Week High of Rs 214.85
With a decisive surge to Rs 214.85 on 16 Jun 2026, Bandhan Bank Ltd. has reached a fresh 52-week high, extending its impressive 20.5% gain over the past year against the Sensex’s decline of 6.08%. This milestone caps a three-day rally that has added 10.7% returns, underscoring the stock’s robust momentum amid a broadly rising market.
Read full news article Announcements
Announcement under Regulation 30 (LODR)-Change in Directorate
19-Jun-2026 | Source : BSEExtension of term of Shri Arun Kumar Singh RBI appointed Additional Director on the Board of the Bank.
Sale Of Identified NPA Portfolio Of The Bank
15-Jun-2026 | Source : BSESale of identified NPA Portfolio of the Bank.
Announcement under Regulation 30 (LODR)-Allotment of ESOP / ESPS
12-Jun-2026 | Source : BSEAllotment of Equity Shares of the Bank pursuant to exercise of Options under Bandhan Bank Employee Stock Option Plan Series 1.
Corporate Actions

No Upcoming Board Meetings

Bandhan Bank Ltd. has declared 15% dividend, ex-date: 14 Aug 25

No Splits history available

No Bonus history available

No Rights history available
Quality key factors
Valuation key factors
Technicals key factors
 Technical Indicator Scale: Bearish, Mildly Bearish, Sideways, Mildly Bullish, Bullish Turned
 Shareholding Snapshot : Mar 2026
Shareholding Compare (%holding)
Promoters
None
Held by 33 Schemes (15.6%)
Held by 238 FIIs (22.07%)
Bandhan Financial Holdings Limited (38.86%)
Sbi Balanced Advantage Fund (4.26%)
13.6%
Quarterly Results Snapshot (Standalone) - Mar'26 - QoQ

QoQ Growth in quarter ended Mar 2026 is -0.05% vs 1.45% in Dec 2025

QoQ Growth in quarter ended Mar 2026 is 159.81% vs 83.78% in Dec 2025
Half Yearly Results Snapshot (Standalone) - Sep'25
Growth in half year ended Sep 2025 is -1.87% vs 22.42% in Sep 2024
Growth in half year ended Sep 2025 is -75.82% vs 38.74% in Sep 2024
Nine Monthly Results Snapshot (Standalone) - Dec'25
YoY Growth in nine months ended Dec 2025 is -1.54% vs 20.72% in Dec 2024
YoY Growth in nine months ended Dec 2025 is -71.60% vs 11.61% in Dec 2024
Annual Results Snapshot (Standalone) - Mar'26
YoY Growth in year ended Mar 2026 is -1.18% vs 16.32% in Mar 2025
YoY Growth in year ended Mar 2026 is -55.43% vs 23.13% in Mar 2025
About Bandhan Bank Ltd.

Company Coordinates


