
Compare Dynamic Cables with Similar Stocks
Dashboard
Strong ability to service debt as the company has a low Debt to EBITDA ratio of 0.33 times
The company has declared Positive results for the last 7 consecutive quarters
With ROE of 18.5, it has a Very Attractive valuation with a 3.4 Price to Book Value
Increasing Participation by Institutional Investors
Underperformed the market in the last 1 year
Stock DNA
Cables - Electricals
INR 1,785 Cr (Small Cap)
19.00
50
0.08%
-0.03
18.47%
3.44
Total Returns (Price + Dividend) 
Latest dividend: 0.25 per share ex-dividend date: Jun-23-2025
Risk Adjusted Returns v/s
Returns Beta

News
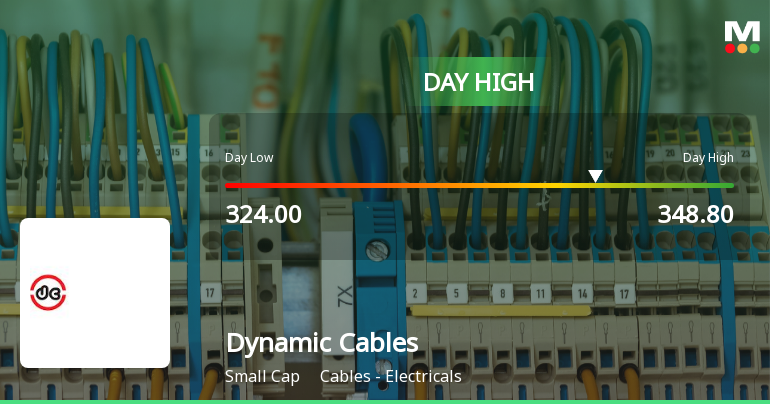
Dynamic Cables Ltd Surges 7.46% to Day's High of Rs 341 — Outperforms Sector by 4.9 Percentage Points
The Sensex edged lower by 0.01% on 18 Jun 2026, while Dynamic Cables Ltd surged 7.46%, marking a notable outperformance of 4.9 percentage points against its sector peers. This sharp intraday gain rewrites the short-term narrative for the small-cap electrical cables company, raising questions about whether this is a breakout or a recovery rally within a broader trend.
Read full news article
Dynamic Cables Ltd is Rated Hold
Dynamic Cables Ltd is rated 'Hold' by MarketsMOJO, with this rating last updated on 08 April 2026. However, the analysis and financial metrics discussed here reflect the company’s current position as of 15 June 2026, providing investors with an up-to-date view of the stock’s fundamentals, valuation, financial trends, and technical outlook.
Read full news article
Dynamic Cables Ltd is Rated Hold by MarketsMOJO
Dynamic Cables Ltd is rated 'Hold' by MarketsMOJO, with this rating last updated on 08 April 2026. However, the analysis and financial metrics discussed here reflect the company’s current position as of 04 June 2026, providing investors with an up-to-date view of its fundamentals, valuation, financial trends, and technical outlook.
Read full news article Announcements
Announcement under Regulation 30 (LODR)-Change in Directorate
16-Jun-2026 | Source : BSEBoard of Directors at their meeting held on June 16 2026 has approved the appointment of Mr. Neeraj Bali as an Additional Director in the category of Non-Executive Independent Director of the company w.e.f June 16 2026.
Intimation Of Record Date For The Purpose Of Final Dividend
16-Jun-2026 | Source : BSEIntimation of Record Date for the purpose of final dividend
Announcement under Regulation 30 (LODR)-Change in Management
16-Jun-2026 | Source : BSEAppointment of Mr. Rasik Mangal as General Manager- Marketing and designated him as Senior Management Personnel
Corporate Actions

No Upcoming Board Meetings

Dynamic Cables Ltd has declared 5% dividend, ex-date: 23 Jun 25

No Splits history available

Dynamic Cables Ltd has announced 1:1 bonus issue, ex-date: 11 Jul 25

No Rights history available
Quality key factors
Valuation key factors
Technicals key factors
 Technical Indicator Scale: Bearish, Mildly Bearish, Sideways, Mildly Bullish, Bullish Turned
 Shareholding Snapshot : Mar 2026
Shareholding Compare (%holding)
Promoters
None
Held by 0 Schemes
Held by 4 FIIs (0.9%)
Ashish Mangal (31.81%)
None
25.91%
Quarterly Results Snapshot (Standalone) - Mar'26 - YoY

YoY Growth in quarter ended Mar 2026 is 7.33% vs 37.47% in Mar 2025
YoY Growth in quarter ended Mar 2026 is 2.59% vs 71.10% in Mar 2025
Half Yearly Results Snapshot (Standalone) - Sep'25
Growth in half year ended Sep 2025 is 22.79% vs 32.23% in Sep 2024
Growth in half year ended Sep 2025 is 48.68% vs 54.52% in Sep 2024
Nine Monthly Results Snapshot (Standalone) - Dec'25
YoY Growth in nine months ended Dec 2025 is 21.34% vs 31.70% in Dec 2024
YoY Growth in nine months ended Dec 2025 is 46.08% vs 71.95% in Dec 2024
Annual Results Snapshot (Standalone) - Mar'26
YoY Growth in year ended Mar 2026 is 16.82% vs 33.51% in Mar 2025
YoY Growth in year ended Mar 2026 is 30.27% vs 71.62% in Mar 2025
About Dynamic Cables Ltd

Company Coordinates


