
Compare Manorama Indust. with Similar Stocks
Dashboard
High Management Efficiency with a high ROCE of 19.17%
Healthy long term growth as Net Sales has grown by an annual rate of 46.29% and Operating profit at 66.54%
The company has declared Positive results for the last 7 consecutive quarters
With ROCE of 38.2, it has a Expensive valuation with a 10.7 Enterprise value to Capital Employed
Majority shareholders : Promoters
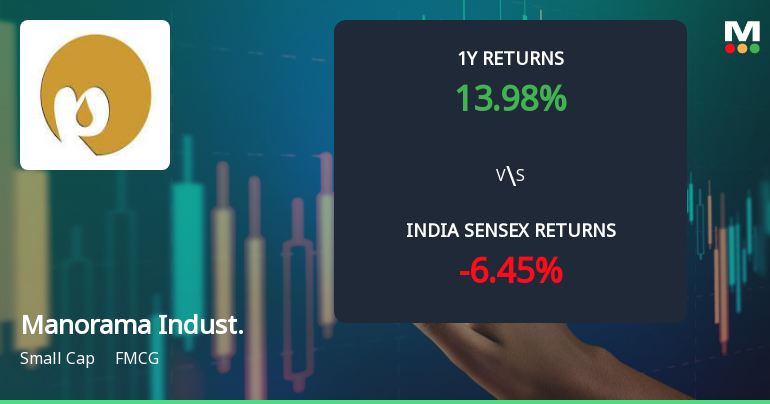
Consistent Returns over the last 3 years
Total Returns (Price + Dividend) 
Latest dividend: 0.6 per share ex-dividend date: Aug-21-2025
Risk Adjusted Returns v/s
Returns Beta

News
Manorama Industries Ltd Technical Momentum Shifts Amid Mixed Indicator Signals
Manorama Industries Ltd, a small-cap player in the FMCG sector, has experienced a nuanced shift in its technical momentum, moving from a bullish to a mildly bullish stance. Despite a slight dip in the daily price, the stock’s technical indicators present a complex picture, with some signals pointing to strength while others suggest caution. This article analyses the recent technical parameter changes, key momentum indicators, and the implications for investors navigating this evolving landscape.
Read full news article
Manorama Industries Ltd is Rated Hold
Manorama Industries Ltd is rated 'Hold' by MarketsMOJO, with this rating last updated on 15 June 2026. However, the analysis and financial metrics discussed here reflect the company’s current position as of 19 June 2026, providing investors with the latest insights into its performance and outlook.
Read full news article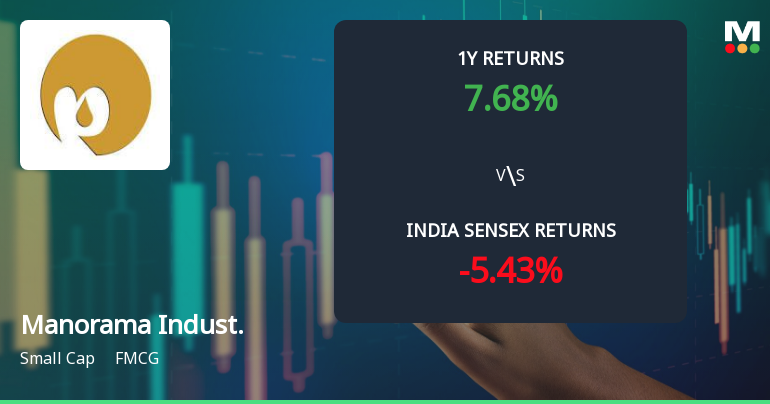
Manorama Industries Ltd Technical Momentum Shifts Signal Bullish Outlook Amid Market Volatility
Manorama Industries Ltd, a small-cap player in the FMCG sector, has witnessed a notable shift in its technical momentum, moving from a mildly bullish stance to a more confident bullish trend. This transition is underscored by a combination of technical indicators including MACD, RSI, moving averages, and Bollinger Bands, signalling a potential uptrend in the stock price amid mixed monthly signals.
Read full news article Announcements
Announcement under Regulation 30 (LODR)-Analyst / Investor Meet - Intimation
13-Jun-2026 | Source : BSEIntimation regarding cancellation of Companys participation in meetings with Analysts/ Institutional Investors under Regulation 30 of SEBI (Listing Obligations and Disclosure requirements) Regulations 2015.
Announcement under Regulation 30 (LODR)-Analyst / Investor Meet - Intimation
10-Jun-2026 | Source : BSEIntimation of Investor Meet
Compliances-Reg.24(A)-Annual Secretarial Compliance
30-May-2026 | Source : BSEAnnual Secretarial Compliance Report for the Financial Year ended 31st March 2026.
Corporate Actions

No Upcoming Board Meetings

Manorama Industries Ltd has declared 30% dividend, ex-date: 21 Aug 25

Manorama Industries Ltd has announced 2:10 stock split, ex-date: 07 Mar 24

No Bonus history available

No Rights history available
Quality key factors
Valuation key factors
Technicals key factors
 Technical Indicator Scale: Bearish, Mildly Bearish, Sideways, Mildly Bullish, Bullish Turned
 Shareholding Snapshot : Mar 2026
Shareholding Compare (%holding)
Promoters
None
Held by 8 Schemes (2.65%)
Held by 74 FIIs (2.89%)
Ashish Ramesh Saraf (46.17%)
Ritu Saraf (7.1%)
33.45%
Quarterly Results Snapshot (Standalone) - Mar'26 - QoQ

QoQ Growth in quarter ended Mar 2026 is 5.45% vs 12.13% in Dec 2025
QoQ Growth in quarter ended Mar 2026 is -12.78% vs 24.34% in Dec 2025
Half Yearly Results Snapshot (Standalone) - Sep'25

Growth in half year ended Sep 2025 is 86.38% vs 43.41% in Sep 2024
Growth in half year ended Sep 2025 is 162.01% vs 99.65% in Sep 2024
Nine Monthly Results Snapshot (Standalone) - Dec'25
YoY Growth in nine months ended Dec 2025 is 81.29% vs 64.16% in Dec 2024
YoY Growth in nine months ended Dec 2025 is 148.93% vs 152.83% in Dec 2024
Annual Results Snapshot (Standalone) - Mar'26
YoY Growth in year ended Mar 2026 is 76.13% vs 68.64% in Mar 2025
YoY Growth in year ended Mar 2026 is 108.14% vs 179.36% in Mar 2025
About Manorama Industries Ltd

Company Coordinates


