
Compare BMW Industries with Similar Stocks
Dashboard
Company has a Debt to Equity ratio (avg) of 0.32 times
The company has declared positive results in Mar'2026 after 3 consecutive negative quarters
With ROCE of 9.7, it has a Attractive valuation with a 1.5 Enterprise value to Capital Employed
Market Beating performance in long term as well as near term
Stock DNA
Iron & Steel Products
INR 1,386 Cr (Micro Cap)
17.00
37
0.70%
0.44
10.10%
1.73
Total Returns (Price + Dividend) 
Latest dividend: 0.43 per share ex-dividend date: Sep-04-2025
Risk Adjusted Returns v/s
Returns Beta

News

BMW Industries Ltd is Rated Buy
BMW Industries Ltd is rated Buy by MarketsMOJO, with this rating last updated on 04 June 2026. However, the analysis and financial metrics discussed below reflect the company’s current position as of 20 June 2026, providing investors with the most up-to-date insight into the stock’s fundamentals, valuation, financial trends, and technical outlook.
Read full news article
BMW Industries Ltd is Rated Buy by MarketsMOJO
BMW Industries Ltd is rated 'Buy' by MarketsMOJO, with this rating last updated on 04 June 2026. However, the analysis and financial metrics discussed here reflect the stock's current position as of 09 June 2026, providing investors with the most up-to-date view of the company’s fundamentals, returns, and technical outlook.
Read full news article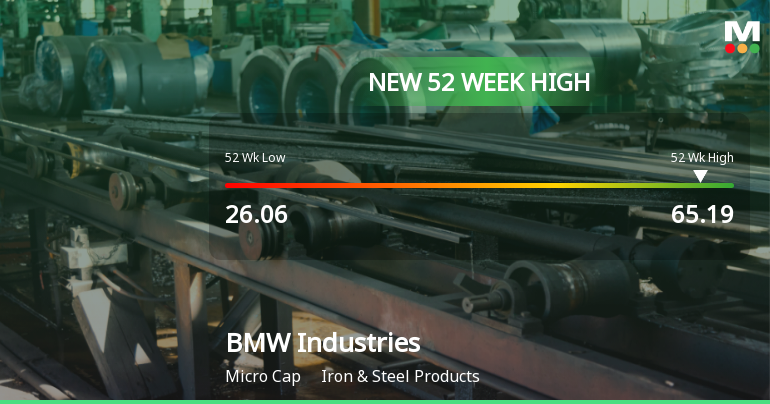
Broad-Based Technical Strength Lifts BMW Industries Ltd to 52-Week High of Rs 65.19
With a decisive surge to Rs 65.19 on 8 Jun 2026, BMW Industries Ltd has reached a fresh 52-week high, marking a significant milestone in its price momentum. This rally stands out amid a broader market environment where the Sensex remains under pressure, underscoring the stock’s robust technical underpinnings and sustained upward trajectory.
Read full news article Announcements
Announcement under Regulation 30 (LODR)-Analyst / Investor Meet - Intimation
01-Jun-2026 | Source : BSEIntimation for the No Deal Road Show to be held on 04th June 2026 and 05th June 2026.
Compliances-Reg.24(A)-Annual Secretarial Compliance
30-May-2026 | Source : BSESecretarial Compliance Report for the Financial Year ended 31st March 2026
Announcement under Regulation 30 (LODR)-Analyst / Investor Meet - Intimation
29-May-2026 | Source : BSEIntimation for No deal Road Show to be held on 03rd June 2026.
Corporate Actions

No Upcoming Board Meetings

BMW Industries Ltd has declared 43% dividend, ex-date: 04 Sep 25

No Splits history available

No Bonus history available

No Rights history available
Quality key factors
Valuation key factors
Technicals key factors
 Technical Indicator Scale: Bearish, Mildly Bearish, Sideways, Mildly Bullish, Bullish Turned
 Shareholding Snapshot : Mar 2026
Shareholding Compare (%holding)
Promoters
None
Held by 0 Schemes
Held by 1 FIIs (0.0%)
Gaungour Sales Private Limited (18.3%)
Merrit Fintrade Pvt Ltd (3.99%)
13.82%
Quarterly Results Snapshot (Consolidated) - Mar'26 - QoQ

QoQ Growth in quarter ended Mar 2026 is 29.19% vs 11.92% in Dec 2025
QoQ Growth in quarter ended Mar 2026 is 88.30% vs 16.24% in Dec 2025
Half Yearly Results Snapshot (Consolidated) - Sep'25

Growth in half year ended Sep 2025 is -9.36% vs 2.19% in Sep 2024
Growth in half year ended Sep 2025 is -24.50% vs 20.98% in Sep 2024
Nine Monthly Results Snapshot (Consolidated) - Dec'25
YoY Growth in nine months ended Dec 2025 is -3.34% vs 2.30% in Dec 2024
YoY Growth in nine months ended Dec 2025 is -16.49% vs 28.42% in Dec 2024
Annual Results Snapshot (Consolidated) - Mar'26
YoY Growth in year ended Mar 2026 is 5.82% vs 5.09% in Mar 2025
YoY Growth in year ended Mar 2026 is 8.09% vs 17.73% in Mar 2025
About BMW Industries Ltd

Company Coordinates


