
Compare TBO Tek with Similar Stocks
Dashboard
High Management Efficiency with a high ROE of 24.07%
The company is Net-Debt Free
Positive results in Mar 26
With ROE of 15.6, it has a Very Expensive valuation with a 10.6 Price to Book Value
High Institutional Holdings at 50.05%
With its market cap of Rs 16,505 cr, it is the second biggest company in the sector (behind I R C T C)and constitutes 19.51% of the entire sector
Stock DNA
Tour, Travel Related Services
INR 16,289 Cr (Small Cap)
68.00
37
0.00%
-0.50
15.62%
10.64
Total Returns (Price + Dividend) 
TBO Tek for the last several years.
Risk Adjusted Returns v/s
Returns Beta

News
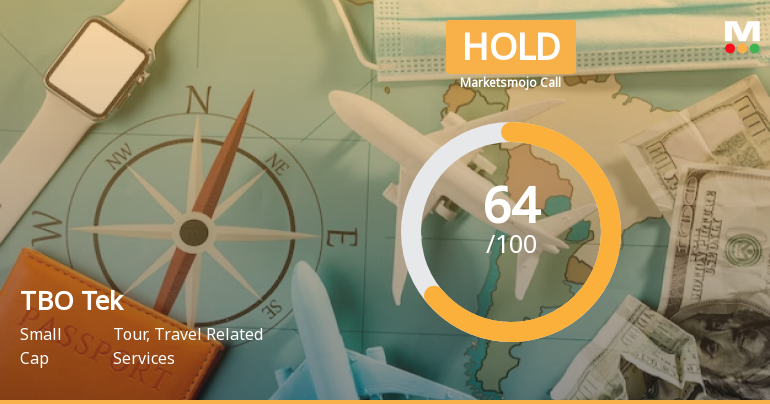
TBO Tek Ltd is Rated Hold by MarketsMOJO
TBO Tek Ltd is rated 'Hold' by MarketsMOJO, with this rating last updated on 15 June 2026. However, all fundamentals, returns, and financial metrics discussed here reflect the company’s current position as of 07 July 2026, providing investors with the latest insights into the stock’s performance and outlook.
Read full news article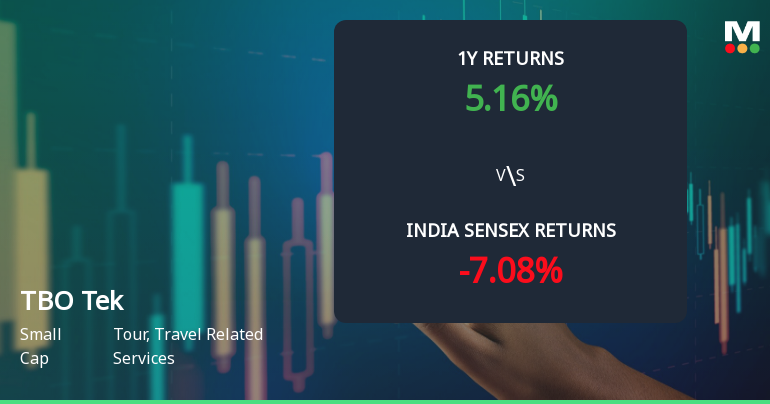
TBO Tek Ltd Technical Momentum Shifts Signal Mildly Bullish Outlook
TBO Tek Ltd, a small-cap player in the Tour and Travel Related Services sector, has exhibited a notable shift in technical momentum, transitioning from a sideways trend to a mildly bullish stance. Recent technical indicators including MACD, RSI, Bollinger Bands, and moving averages reveal a nuanced picture of the stock’s price dynamics, suggesting cautious optimism for investors amid a recovering travel industry backdrop.
Read full news article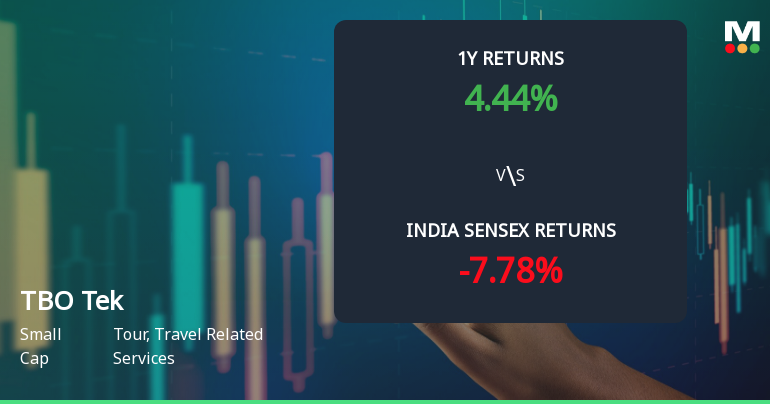
TBO Tek Ltd Technical Momentum Shifts Amid Mixed Market Signals
TBO Tek Ltd has witnessed a notable shift in its technical momentum, moving from a mildly bullish stance to a sideways trend, reflecting a complex interplay of indicator signals. Despite a strong day gain of 5.75%, the stock’s technical indicators present a mixed picture, with some metrics signalling caution while others suggest underlying strength in the tour and travel related services sector.
Read full news article Announcements
Closure of Trading Window
29-Jun-2026 | Source : BSEPlease find enclosed the Trading Window Closure Intimation.
TBO Tek Limited Has Informed The Exchange Regarding The Name Change Of Wholly Owned Subsidiary.
11-Jun-2026 | Source : BSEPlease find enclosed the Intimation.
Announcement under Regulation 30 (LODR)-Earnings Call Transcript
04-Jun-2026 | Source : BSEPlease find enclosed the Transcript of the Investor Earnings Conference Call.
Corporate Actions

No Upcoming Board Meetings

No Dividend history available

No Splits history available

No Bonus history available

No Rights history available
Quality key factors
Valuation key factors
Technicals key factors
 Technical Indicator Scale: Bearish, Mildly Bearish, Sideways, Mildly Bullish, Bullish Turned
 Shareholding Snapshot : Mar 2026
Shareholding Compare (%holding)
Promoters
None
Held by 25 Schemes (17.63%)
Held by 79 FIIs (29.71%)
Lap Travel Private Limited (21.6%)
General Atlantic Singapore Tbo Pte. Ltd (14.4%)
3.08%
Quarterly Results Snapshot (Consolidated) - Mar'26 - QoQ

QoQ Growth in quarter ended Mar 2026 is 3.83% vs 38.21% in Dec 2025

QoQ Growth in quarter ended Mar 2026 is 11.94% vs -20.52% in Dec 2025
Half Yearly Results Snapshot (Consolidated) - Sep'25
Growth in half year ended Sep 2025 is 24.12% vs 24.72% in Sep 2024
Growth in half year ended Sep 2025 is 7.86% vs 16.15% in Sep 2024
Nine Monthly Results Snapshot (Consolidated) - Dec'25
YoY Growth in nine months ended Dec 2025 is 44.28% vs 26.14% in Dec 2024
YoY Growth in nine months ended Dec 2025 is 7.73% vs 9.91% in Dec 2024
Annual Results Snapshot (Consolidated) - Mar'26
YoY Growth in year ended Mar 2026 is 54.10% vs 24.74% in Mar 2025
YoY Growth in year ended Mar 2026 is 6.27% vs 13.72% in Mar 2025
About TBO Tek Ltd

Company Coordinates


