
Compare KSR Footwear with Similar Stocks
Dashboard
Weak Long Term Fundamental Strength with an average Return on Capital Employed (ROCE) of 0%
- Poor long term growth as Net Sales has grown by an annual rate of 0% and Operating profit at 0% over the last 5 years
- Low ability to service debt as the company has a high Debt to EBITDA ratio of -4.10 times
Risky - Negative EBITDA
Falling Participation by Institutional Investors
Stock DNA
Footwear
INR 59 Cr (Micro Cap)
NA (Loss Making)
19
0.00%
0.41
-16.20%
0.78
Total Returns (Price + Dividend) 
KSR Footwear for the last several years.
Risk Adjusted Returns v/s
Returns Beta

News

KSR Footwear Ltd Locks at Upper Circuit With 5% Gain — Buyers Queue, Sellers Absent
At Rs 31.74, the buying was done — not because demand dried up, but because the exchange wouldn't let the stock go any higher. KSR Footwear Ltd locked at its upper circuit of 5% on 18 Jun 2026, with buyers queuing and no sellers willing to part with shares.
Read full news article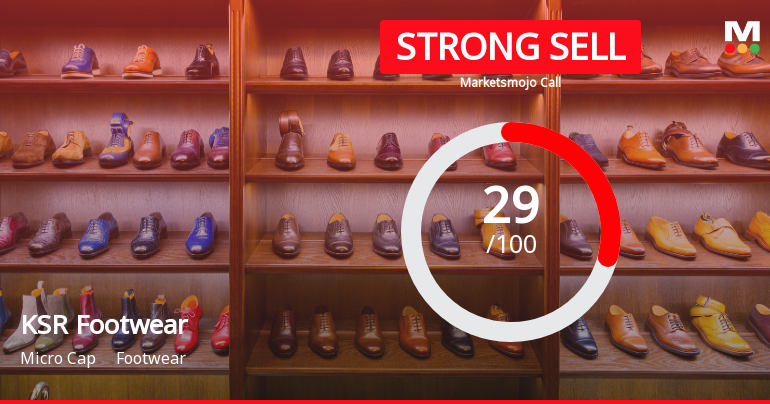
KSR Footwear Ltd Downgraded to Strong Sell Amid Technical and Fundamental Concerns
KSR Footwear Ltd has seen its investment rating downgraded from Sell to Strong Sell as of 10 June 2026, reflecting deteriorating technical indicators and persistent fundamental challenges. The micro-cap footwear company’s Mojo Score has slipped to 29.0, signalling heightened risk for investors amid sideways technical trends and weak financial metrics.
Read full news article
KSR Footwear Ltd Locks at Upper Circuit With 4.97% Gain — Buyers Queue, Sellers Absent
At Rs 33.55, the buying was done — not because demand dried up, but because the exchange wouldn't let the stock go any higher. KSR Footwear Ltd locked at its upper circuit of 4.97% on 1 Jun 2026, with buyers queuing and no sellers willing to part with shares.
Read full news article Announcements
Compliances-Reg.24(A)-Annual Secretarial Compliance
29-May-2026 | Source : BSEAnnual Secretarial Compliance Report for the financial year ended March 31 2026
Announcement under Regulation 30 (LODR)-Newspaper Publication
23-May-2026 | Source : BSENewspaper Advertisement w.r.t. Audited Standalone Financial Results of the Company for the quarter and financial year ended March 31 2026
Audited Standalone Financial Results For The Quarter And Year Ended March 31 2026
22-May-2026 | Source : BSEAudited Standalone Financial Results for the quarter and year ended March 31 2026
Corporate Actions

No Upcoming Board Meetings

No Dividend history available

No Splits history available

No Bonus history available

No Rights history available
Quality key factors
Valuation key factors
Technicals key factors
 Technical Indicator Scale: Bearish, Mildly Bearish, Sideways, Mildly Bullish, Bullish Turned
 Shareholding Snapshot : Mar 2026
Shareholding Compare (%holding)
Promoters
None
Held by 0 Schemes
Held by 1 FIIs (0.01%)
Khadim Development Company Private Limited (50.46%)
Bharadhwajan Jaganathan Velamur (4.49%)
33.89%
Quarterly Results Snapshot (Standalone) - Mar'26 - QoQ

QoQ Growth in quarter ended Mar 2026 is 33.47% vs 6.46% in Dec 2025
QoQ Growth in quarter ended Mar 2026 is 232.38% vs 58.14% in Dec 2025
Half Yearly Results Snapshot (Standalone) - Sep'25
Not Applicable: The company has declared_date for only one period
Not Applicable: The company has declared_date for only one period
Nine Monthly Results Snapshot (Standalone) - Dec'25
Not Applicable: The company has declared_date for only one period
Not Applicable: The company has declared_date for only one period
Annual Results Snapshot (Standalone) - Mar'26
Not Applicable: The company has declared_date for only one period
Not Applicable: The company has declared_date for only one period
About KSR Footwear Ltd

Company Coordinates


