
Compare Amagi Media Labs with Similar Stocks
Dashboard
Poor Management Efficiency with a low ROE of 0%
- The company has reported losses. Due to this company has reported negative ROE
Low ability to service debt as the company has a high Debt to EBITDA ratio of 0.62 times
Healthy long term growth as Net Sales has grown by an annual rate of 0% and Operating profit at 0%
Flat results in Mar 26
With ROE of 4.1, it has a Very Expensive valuation with a 7.5 Price to Book Value
High Institutional Holdings at 79.45%
With its market cap of Rs 13,147 cr, it is the second biggest company in the sector (behind Prime Focus)and constitutes 26.14% of the entire sector
Stock DNA
Media & Entertainment
INR 12,872 Cr (Mid Cap)
230.00
70
0.00%
-0.81
4.08%
7.48
Total Returns (Price + Dividend) 
Amagi Media Labs for the last several years.
Risk Adjusted Returns v/s
Returns Beta

News
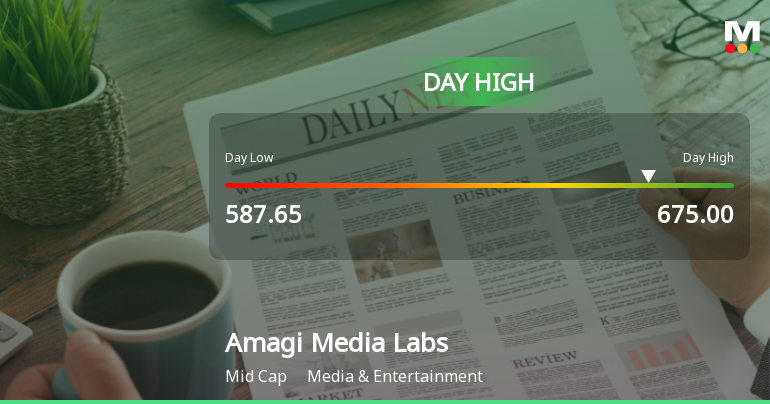
Amagi Media Labs Ltd Surges 5.03% to Day's High of Rs 645 — Outperforms Sector by 5.55 Percentage Points
The Sensex declined 0.64% on 23 Jul 2026, yet Amagi Media Labs Ltd surged 5.03%, touching a new 52-week and all-time high of Rs 645. This 5.55 percentage-point outperformance over its Media & Entertainment sector peers highlights a distinctly stock-specific rally rather than a market-wide uplift.
Read full news article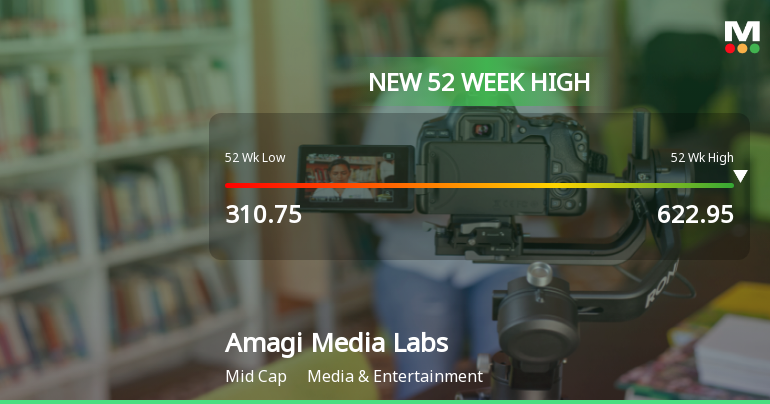
Broad-Based Technical Strength Lifts Amagi Media Labs Ltd to 52-Week High of Rs 622.95
With a decisive surge to Rs 622.95 on 23 Jul 2026, Amagi Media Labs Ltd has reached a fresh 52-week and all-time high, marking a remarkable recovery from its low of Rs 310.75 over the past year. This milestone is underpinned by a strong alignment of technical indicators and sustained price momentum, even as the broader market trades cautiously.
Read full news article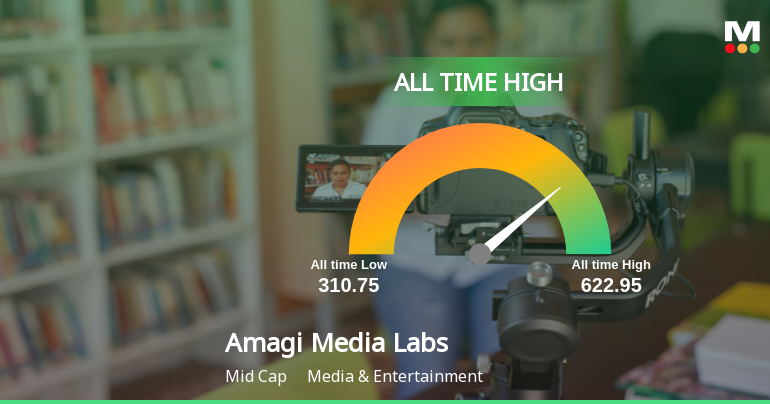
Announcements
Announcement under Regulation 30 (LODR)-Earnings Call Transcript
10-Jul-2026 | Source : BSETranscript of the webinar titled AI in Media hosted by the Company on July 07 2026
Compliances-Certificate under Reg. 74 (5) of SEBI (DP) Regulations 2018
10-Jul-2026 | Source : BSECertificate under Regulation 74(5) of SEBI (DP) Regulations 2018 for the quarter ended June 30 2026.
Announcement under Regulation 30 (LODR)-Analyst / Investor Meet - Outcome
07-Jul-2026 | Source : BSERecording containing the audio and video of the webinar titled AI in Media.
Corporate Actions

No Upcoming Board Meetings

No Dividend history available

No Splits history available

No Bonus history available

No Rights history available
Quality key factors
Valuation key factors
Technicals key factors
 Technical Indicator Scale: Bearish, Mildly Bearish, Sideways, Mildly Bullish, Bullish Turned
 Shareholding Snapshot : Mar 2026
Shareholding Compare (%holding)
FIIs
3.0975
Held by 12 Schemes (15.0%)
Held by 29 FIIs (42.43%)
Arunachalam Srinivasan Karapattu (4.46%)
Pi Opportunities Fund-ii (14.47%)
1.14%
Quarterly Results Snapshot (Standalone) - Mar'26 - QoQ

QoQ Growth in quarter ended Mar 2026 is -4.99% vs 13.01% in Dec 2025
QoQ Growth in quarter ended Mar 2026 is 4.34% vs 386.06% in Dec 2025
Half Yearly Results Snapshot (Consolidated) - Sep'25
Not Applicable: The company has declared_date for only one period
Not Applicable: The company has declared_date for only one period
Nine Monthly Results Snapshot (Consolidated) - Dec'25
Not Applicable: The company has declared_date for only one period
Not Applicable: The company has declared_date for only one period
Annual Results Snapshot (Consolidated) - Mar'26
YoY Growth in year ended Mar 2026 is 29.50% vs 32.24% in Mar 2025

YoY Growth in year ended Mar 2026 is 204.31% vs 71.96% in Mar 2025
About Amagi Media Labs Ltd

Company Coordinates


