
Compare Sainik Finance with Similar Stocks
Stock DNA
Cement & Cement Products
INR 44 Cr (Micro Cap)
10.00
27
0.00%
2.17
8.66%
0.89
Total Returns (Price + Dividend) 
Sainik Finance for the last several years.
Risk Adjusted Returns v/s
Returns Beta

News

Sainik Finance & Industries Ltd is Rated Strong Sell
Sainik Finance & Industries Ltd is rated Strong Sell by MarketsMOJO, with this rating last updated on 29 May 2026. However, the analysis and financial metrics presented here reflect the company’s current position as of 18 June 2026, providing investors with an up-to-date view of the stock’s fundamentals, returns, and technical outlook.
Read full news article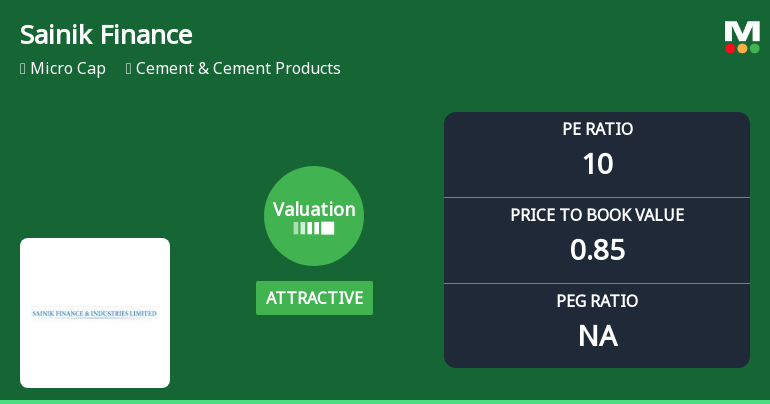
Sainik Finance & Industries Ltd: Valuation Shifts Signal Changing Price Attractiveness
Sainik Finance & Industries Ltd has witnessed a notable shift in its valuation parameters, moving from a very attractive to an attractive rating, reflecting evolving investor perceptions amid a challenging market backdrop. Despite a recent sharp decline in share price, the company’s price-to-earnings (P/E) and price-to-book value (P/BV) ratios suggest a more compelling entry point relative to peers and historical averages.
Read full news article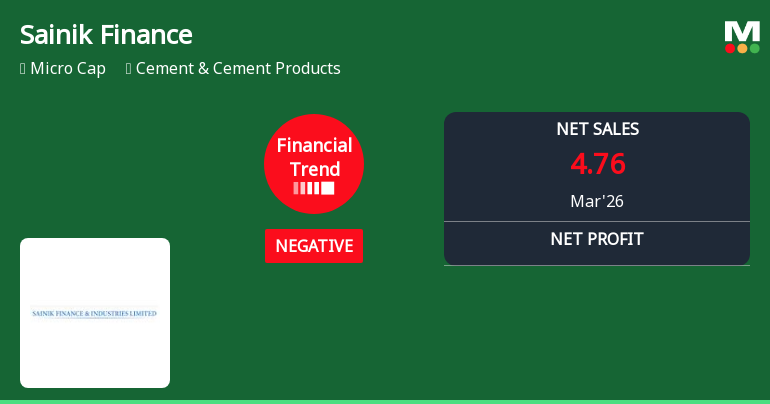
Sainik Finance & Industries Ltd Reports Negative Quarterly Financial Trend Amid Mixed Market Returns
Sainik Finance & Industries Ltd, a micro-cap player in the Cement & Cement Products sector, has reported a marked deterioration in its financial trend for the quarter ended March 2026. The company’s financial trend score has shifted from flat to negative, reflecting significant contraction in profitability and margin pressures, despite a modest uptick in its stock price.
Read full news article Announcements
Announcement under Regulation 30 (LODR)-Newspaper Publication
29-May-2026 | Source : BSESubmission of copiesof newspaper in which audited financial results of the Company for the quarter /year ended 31.03.2026 is published
Submission Of Financial Results Of The Company For The Quarter And Financial Year Ended 31.03.2026
28-May-2026 | Source : BSESubmission of Audited Financial Results of the Company for the Quarter and Financial year ended 31st March 2026
Board Meeting Outcome for Submisison Of Audited Financial Results Of The Company For The Financial Year Ended 31.03.2026
28-May-2026 | Source : BSESubmisison of Audited Financial Results of the Company for the quarter and year ended 31.03.2026
Corporate Actions

No Upcoming Board Meetings

No Dividend history available

No Splits history available

No Bonus history available

No Rights history available
Quality key factors
Valuation key factors
Technicals key factors
 Technical Indicator Scale: Bearish, Mildly Bearish, Sideways, Mildly Bullish, Bullish Turned
 Shareholding Snapshot : Mar 2026
Shareholding Compare (%holding)
Promoters
None
Held by 0 Schemes
Held by 0 FIIs
Kuldeep Singh Solanki (23.01%)
Manak Vanijya Private Limited (3.14%)
21.95%
Quarterly Results Snapshot (Standalone) - Mar'26 - YoY

YoY Growth in quarter ended Mar 2026 is -9.51% vs 42.55% in Mar 2025
YoY Growth in quarter ended Mar 2026 is -52.81% vs 444.90% in Mar 2025
Half Yearly Results Snapshot (Standalone) - Sep'25

Growth in half year ended Sep 2025 is 2.94% vs -4.71% in Sep 2024
Growth in half year ended Sep 2025 is -20.00% vs 9.95% in Sep 2024
Nine Monthly Results Snapshot (Standalone) - Dec'25
YoY Growth in nine months ended Dec 2025 is 6.13% vs -1.21% in Dec 2024
YoY Growth in nine months ended Dec 2025 is -16.57% vs 131.79% in Dec 2024
Annual Results Snapshot (Standalone) - Mar'26
YoY Growth in year ended Mar 2026 is 1.26% vs 9.31% in Mar 2025
YoY Growth in year ended Mar 2026 is -32.52% vs 209.00% in Mar 2025
About Sainik Finance & Industries Ltd

Company Coordinates


