
Compare IndusInd Bank with Similar Stocks
Total Returns (Price + Dividend) 
Latest dividend: 16.5 per share ex-dividend date: Jun-28-2024
Risk Adjusted Returns v/s
Returns Beta

News

IndusInd Bank Upgraded to Buy on Improved Valuation and Financial Metrics
IndusInd Bank Ltd. has seen its investment rating upgraded from Hold to Buy, driven primarily by a significant improvement in its valuation grade alongside stable quality and technical parameters. The mid-cap private sector bank’s recent performance and financial metrics have prompted analysts to revise their outlook, reflecting a more favourable risk-reward profile despite some lingering concerns over profitability trends.
Read full news article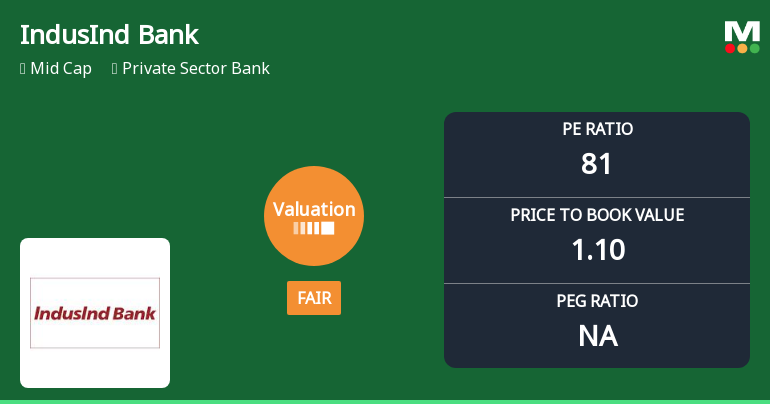
IndusInd Bank Valuation Shifts to Fair; Market Sentiment Adjusts Amidst Mixed Returns
IndusInd Bank Ltd., a prominent player in the private sector banking space, has witnessed a notable shift in its valuation parameters, moving from an expensive to a fair valuation grade. This change, coupled with its recent market performance and peer comparisons, offers investors a fresh perspective on the stock’s price attractiveness amid a challenging banking sector landscape.
Read full news article
IndusInd Bank Ltd. is Rated Hold by MarketsMOJO
IndusInd Bank Ltd. is rated 'Hold' by MarketsMOJO, with this rating last updated on 06 April 2026. While the rating change occurred on that date, the analysis and financial metrics discussed here reflect the stock's current position as of 12 June 2026, providing investors with an up-to-date view of the bank's performance and outlook.
Read full news article Announcements
Closure of Trading Window
18-Jun-2026 | Source : BSEPlease find attached herewith intimation for closure of trading window.
Announcement under Regulation 30 (LODR)-Newspaper Publication
09-Jun-2026 | Source : BSEPlease find attached herewith the captioned intimation
Announcement under Regulation 30 (LODR)-Analyst / Investor Meet - Outcome
08-Jun-2026 | Source : BSEPlease find attached herewith the captioned intimation
Corporate Actions

No Upcoming Board Meetings

IndusInd Bank Ltd. has declared 15% dividend, ex-date: 25 Jun 26

No Splits history available

No Bonus history available

No Rights history available
Quality key factors
Valuation key factors
Technicals key factors
 Technical Indicator Scale: Bearish, Mildly Bearish, Sideways, Mildly Bullish, Bullish Turned
 Shareholding Snapshot : Mar 2026
Shareholding Compare (%holding)
Mutual Funds
42.7751
Held by 39 Schemes (30.11%)
Held by 598 FIIs (28.57%)
Indusind International Holdings Limited (10.53%)
Icici Prudential Multi-asset Fund (5.89%)
8.71%
Quarterly Results Snapshot (Standalone) - Mar'26 - YoY

YoY Growth in quarter ended Mar 2026 is 3.49% vs -12.83% in Mar 2025
YoY Growth in quarter ended Mar 2026 is 123.82% vs -195.28% in Mar 2025
Half Yearly Results Snapshot (Standalone) - Sep'25

Growth in half year ended Sep 2025 is -5.39% vs 14.81% in Sep 2024
Growth in half year ended Sep 2025 is -93.11% vs -19.22% in Sep 2024
Nine Monthly Results Snapshot (Standalone) - Dec'25
YoY Growth in nine months ended Dec 2025 is -7.33% vs 13.37% in Dec 2024
YoY Growth in nine months ended Dec 2025 is -91.79% vs -26.11% in Dec 2024
Annual Results Snapshot (Standalone) - Mar'26
YoY Growth in year ended Mar 2026 is -4.97% vs 6.38% in Mar 2025
YoY Growth in year ended Mar 2026 is -64.69% vs -70.47% in Mar 2025
About IndusInd Bank Ltd.

Company Coordinates


