
Compare DCB Bank with Similar Stocks
Dashboard
Strong lending practices with low Gross NPA ratio of 2.45%
Strong Long Term Fundamental Strength with a 16.85% CAGR growth in Net Profits
Healthy long term growth as Net profit has grown by an annual rate of 16.85%
The company has declared Positive results for the last 6 consecutive quarters
With ROA of 0.8, it has a Attractive valuation with a 0.9 Price to Book Value
Total Returns (Price + Dividend) 
Latest dividend: 1.406644332774986 per share ex-dividend date: Jun-12-2026
Risk Adjusted Returns v/s
Returns Beta

News

DCB Bank Ltd. Technical Momentum Shifts Signal Mildly Bullish Outlook
DCB Bank Ltd., a small-cap player in the private sector banking space, has exhibited a notable shift in its technical momentum, reflecting a cautiously optimistic outlook. Recent price movements and technical indicators reveal a transition from a strongly bullish trend to a mildly bullish stance, signalling nuanced market sentiment as the stock trades near ₹187.30, up 1.46% on 23 June 2026.
Read full news article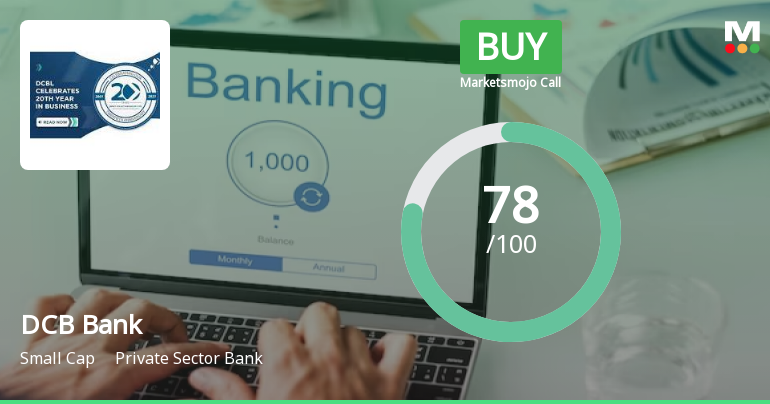
DCB Bank Ltd. is Rated Buy
DCB Bank Ltd. is rated 'Buy' by MarketsMOJO, with this rating last updated on 21 April 2026. However, the analysis and financial metrics discussed here reflect the stock's current position as of 19 June 2026, providing investors with the most up-to-date view of the company’s performance and outlook.
Read full news article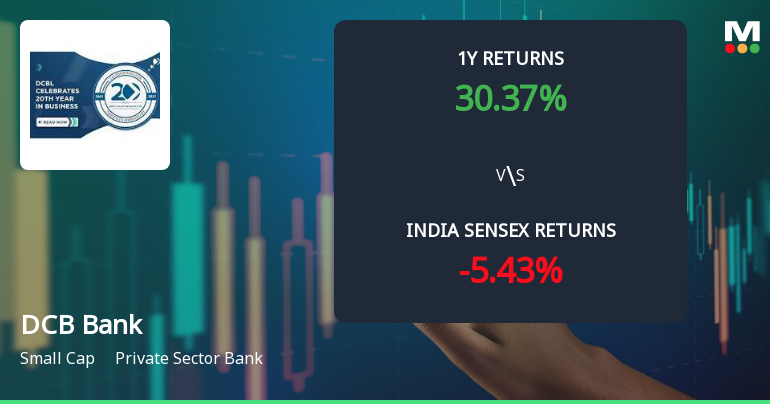
DCB Bank Ltd. Technical Momentum Shifts Signal Bullish Outlook Amid Market Recovery
DCB Bank Ltd. has exhibited a notable shift in its technical momentum, moving from a mildly bullish stance to a more confident bullish trend. This transition is underpinned by a combination of technical indicators including MACD, RSI, moving averages, and Bollinger Bands, signalling a positive outlook for the private sector bank amid a recovering market environment.
Read full news article Announcements
Closure of Trading Window
15-Jun-2026 | Source : BSEThis is to inform you that pursuant to the requirements of SEBI (Prohibition of Insider Trading) Regulations 2015 as amended from time to time and DCB Bank- Code of Conduct for Prohibition of Insider Trading the trading window for dealing in the securities of DCB Bank Limited (the Bank) shall remain closed for all the designated persons from June 16 2026 till 48 hours after the declaration of the Financial Results of the Bank for the quarter ending June 30 2026. The date of Board Meeting in which the financial results would be considered shall be intimated separately in due course. This intimation is also being uploaded on website of the Bank at www.dcb.bank.in You are requested to take the above information on your record.
Announcement under Regulation 30 (LODR)-Newspaper Publication
12-Jun-2026 | Source : BSEPlease find attached copies of the newspaper advertisement pertaining to Notice of the 31st Annual General Meeting and e-voting information and Special window for transfer and dematerialisation of physical shares of DCB Bank Limited. published in Business Standard (English) and Pudhari (Marathi) on June 12 2026. The above information is also available on the website of the Bank at www.dcb.bank.in This is for your information and record.
Intimation About Approval Of The Reserve Bank Of India For Appointment Of Mr. Pushan Mahapatra As The Non-Executive Part-Time Chairman Of The Bank
12-Jun-2026 | Source : BSEFurther to our earlier intimation vide letter Ref. No.CO:CS:RC:2025-26:311 dated March 09 2026 we wish to inform you that the Reserve Bank of India (RBI) vide its letter dated June 12 2026 has approved the appointment of Mr. Pushan Mahapatra (DIN: 07307428) as the Non-Executive Part Time Chairman of the Bank in terms of applicable provisions of Banking Regulation Act 1949 effective from the date of the RBI communication i.e. June 12 2026 till March 09 2029. Accordingly the Board of Directors of the Bank vide its resolution dated June 12 2026 has approved the appointment of Mr. Mahapatra as the Non-Executive Part Time Chairman of the Bank. Kindly take note of the above submission in compliance with Regulation 30 and other applicable provisions of the SEBI (Listing Obligations and Disclosure Requirements) Regulations 2015.
Corporate Actions

No Upcoming Board Meetings

DCB Bank Ltd. has declared 14% dividend, ex-date: 12 Jun 26

No Splits history available

No Bonus history available

No Rights history available
Quality key factors
Valuation key factors
Technicals key factors
 Technical Indicator Scale: Bearish, Mildly Bearish, Sideways, Mildly Bullish, Bullish Turned
 Shareholding Snapshot : Mar 2026
Shareholding Compare (%holding)
Non Institution
None
Held by 13 Schemes (24.2%)
Held by 114 FIIs (12.64%)
Aga Khan Fund For Economic Development Sa (15.47%)
Tata Mutual Fund - Tata Small Cap Fund (all Schemes) (5.04%)
27.86%
Quarterly Results Snapshot (Standalone) - Mar'26 - QoQ

QoQ Growth in quarter ended Mar 2026 is 2.49% vs 2.09% in Dec 2025
QoQ Growth in quarter ended Mar 2026 is 11.32% vs 0.45% in Dec 2025
Half Yearly Results Snapshot (Standalone) - Sep'25

Growth in half year ended Sep 2025 is 18.93% vs 20.22% in Sep 2024
Growth in half year ended Sep 2025 is 18.95% vs 13.05% in Sep 2024
Nine Monthly Results Snapshot (Standalone) - Dec'25
YoY Growth in nine months ended Dec 2025 is 16.25% vs 20.71% in Dec 2024
YoY Growth in nine months ended Dec 2025 is 20.00% vs 15.24% in Dec 2024
Annual Results Snapshot (Standalone) - Mar'26
YoY Growth in year ended Mar 2026 is 14.43% vs 20.67% in Mar 2025
YoY Growth in year ended Mar 2026 is 18.89% vs 14.81% in Mar 2025
About DCB Bank Ltd.

Company Coordinates


