
Compare Dhanlaxmi Bank with Similar Stocks
Dashboard
Strong Long Term Fundamental Strength with a 22.54% CAGR growth in Net Profits
Healthy long term growth as Net profit has grown by an annual rate of 22.54%
With a growth in Operating Profit of 193.87%, the company declared Outstanding results in Mar 26
With ROA of 0.5, it has a Very Attractive valuation with a 0.9 Price to Book Value
Market Beating performance in long term as well as near term
Total Returns (Price + Dividend) 
Latest dividend: 0.5 per share ex-dividend date: Jun-10-2011
Risk Adjusted Returns v/s
Returns Beta

News

Dhanlaxmi Bank Ltd Downgraded to Buy Amid Technical Softening Despite Strong Fundamentals
Dhanlaxmi Bank Ltd, a micro-cap player in the private sector banking space, has seen its investment rating downgraded from Strong Buy to Buy as of 29 June 2026. This adjustment reflects a nuanced reassessment across four key parameters: quality, valuation, financial trend, and technicals. While the bank continues to demonstrate robust fundamentals and healthy long-term growth, recent technical indicators have softened, prompting a more cautious stance from analysts.
Read full news article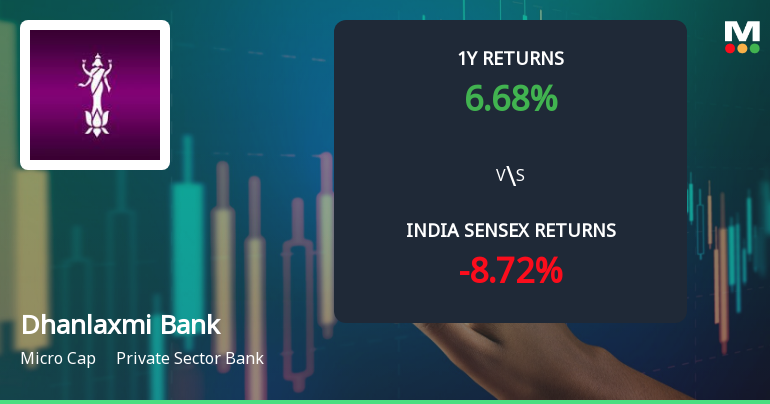
Dhanlaxmi Bank Ltd Technical Momentum Shifts Amid Mixed Market Signals
Dhanlaxmi Bank Ltd, a micro-cap player in the private sector banking space, has witnessed a subtle shift in its technical momentum, moving from a bullish to a mildly bullish stance. Despite a recent day decline of 1.34%, the stock’s broader technical indicators reveal a nuanced picture, with mixed signals from MACD, RSI, moving averages, and other momentum oscillators. This article analyses these technical parameters in detail, placing the stock’s performance in the context of market trends and investor sentiment.
Read full news article
Dhanlaxmi Bank Ltd is Rated Strong Buy
Dhanlaxmi Bank Ltd is rated 'Strong Buy' by MarketsMOJO, with this rating last updated on 15 June 2026. However, the analysis and financial metrics discussed here reflect the stock's current position as of 27 June 2026, providing investors with the latest insights into its performance and outlook.
Read full news article Announcements
Closure of Trading Window
25-Jun-2026 | Source : BSEClosure of Trading window w.e.f July 01 2026
Announcement under Regulation 30 (LODR)-Change in Management
15-Jun-2026 | Source : BSEChange in Management
Compliances-Reg.24(A)-Annual Secretarial Compliance
30-May-2026 | Source : BSESecretarial Compliance Report - Regulation 24A of SEBI (LODR) Regulations 2015
Corporate Actions

No Upcoming Board Meetings

Dhanlaxmi Bank Ltd has declared 5% dividend, ex-date: 10 Jun 11

No Splits history available

No Bonus history available

Dhanlaxmi Bank Ltd has announced 14:25 rights issue, ex-date: 27 Dec 24
Quality key factors
Valuation key factors
Technicals key factors
 Technical Indicator Scale: Bearish, Mildly Bearish, Sideways, Mildly Bullish, Bullish Turned
 Shareholding Snapshot : Mar 2026
Shareholding Compare (%holding)
Non Institution
None
Held by 0 Schemes
Held by 31 FIIs (15.42%)
None
B Ravindran Pillai (10%)
42.48%
Quarterly Results Snapshot (Standalone) - Mar'26 - YoY

YoY Growth in quarter ended Mar 2026 is 26.36% vs 14.5% in Mar 2025

YoY Growth in quarter ended Mar 2026 is 50.07% vs 775.53% in Mar 2025
Half Yearly Results Snapshot (Standalone) - Sep'25
Growth in half year ended Sep 2025 is 18.39% vs 7.02% in Sep 2024
Growth in half year ended Sep 2025 is 98.65% vs -65.39% in Sep 2024
Nine Monthly Results Snapshot (Standalone) - Dec'25
YoY Growth in nine months ended Dec 2025 is 19.52% vs 7.6% in Dec 2024
YoY Growth in nine months ended Dec 2025 is 57.36% vs -30.91% in Dec 2024
Annual Results Snapshot (Standalone) - Mar'26
YoY Growth in year ended Mar 2026 is 21.34% vs 9.35% in Mar 2025
YoY Growth in year ended Mar 2026 is 54.19% vs 15.25% in Mar 2025
About Dhanlaxmi Bank Ltd

Company Coordinates


