
Compare CSB Bank with Similar Stocks
Total Returns (Price + Dividend) 
CSB Bank for the last several years.
Risk Adjusted Returns v/s
Returns Beta

News
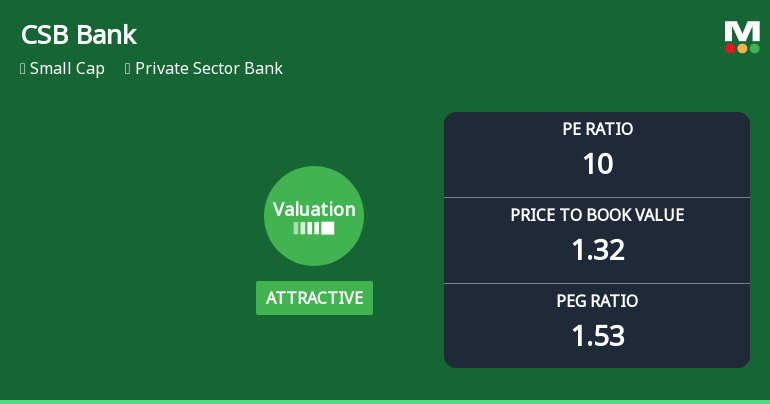
CSB Bank Ltd Valuation Shifts Signal Renewed Price Attractiveness Amid Sector Challenges
CSB Bank Ltd has seen a notable shift in its valuation parameters, moving from a fair to an attractive rating despite recent share price declines. This repositioning comes amid broader sector challenges and a mixed performance relative to the Sensex, prompting a reassessment of its price-to-earnings and price-to-book value metrics against historical and peer averages.
Read full news articleAre CSB Bank Ltd latest results good or bad?
CSB Bank Ltd's latest results for Q4 FY26 present a mixed operational picture. The bank reported a net profit of ₹201.58 crores, reflecting a significant increase of 32.04% compared to the previous quarter, driven primarily by a substantial reduction in provisions, which fell by 73.47% QoQ. This reduction in provisioning expenses contributed positively to the bank's profitability, although it raises questions about the sustainability of earnings quality given the concurrent rise in gross non-performing assets (NPA). The net interest income (NII) also showed growth, reaching ₹464.16 crores, which is a 2.42% increase QoQ and a robust 25.02% growth YoY. This growth in NII was supported by a notable rise in interest earned, which reached ₹1,200.86 crores, marking the highest quarterly figure in the bank's recent history. However, the gross NPA ratio has risen to 1.96%, indicating potential stress in the loan b...
Read full news article
CSB Bank Q4 FY26: Strong Profit Growth Masks Asset Quality Concerns
CSB Bank Ltd., one of India's fastest-growing private sector banks with a strong presence in Kerala's Thrissur district, reported robust net profit growth of 32.04% quarter-on-quarter (QoQ) in Q4 FY26, reaching ₹201.58 crores compared to ₹152.67 crores in Q3 FY26. However, the impressive bottom-line performance was accompanied by a concerning deterioration in asset quality metrics, with gross non-performing assets (GNPA) climbing to 1.96% from 1.81% in the previous quarter. The stock traded at ₹385.95 on May 05, 2026, down 1.53% from its previous close, reflecting investor caution despite the strong quarterly earnings.
Read full news article Announcements
Corporate Actions

No Upcoming Board Meetings

No Dividend history available

No Splits history available

No Bonus history available

No Rights history available
Quality key factors
Valuation key factors
Technicals key factors
 Technical Indicator Scale: Bearish, Mildly Bearish, Sideways, Mildly Bullish, Bullish Turned
 Shareholding Snapshot : Mar 2026
Shareholding Compare (%holding)
Promoters
None
Held by 14 Schemes (12.34%)
Held by 95 FIIs (12.84%)
Fih Mauritius Investments Ltd (40.0%)
Sbi Small Cap Fund (6.34%)
19.17%
Quarterly Results Snapshot (Standalone) - Mar'26 - QoQ

QoQ Growth in quarter ended Mar 2026 is 4.04% vs 4.06% in Dec 2025

QoQ Growth in quarter ended Mar 2026 is 32.04% vs -4.78% in Dec 2025
Half Yearly Results Snapshot (Standalone) - Sep'25
Growth in half year ended Sep 2025 is 26.71% vs 23.78% in Sep 2024
Growth in half year ended Sep 2025 is 10.81% vs -5.15% in Sep 2024
Nine Monthly Results Snapshot (Standalone) - Dec'25
YoY Growth in nine months ended Dec 2025 is 26.3% vs 22.68% in Dec 2024
YoY Growth in nine months ended Dec 2025 is 7.00% vs -2.89% in Dec 2024
Annual Results Snapshot (Standalone) - Mar'26
YoY Growth in year ended Mar 2026 is 25.24% vs 22.87% in Mar 2025
YoY Growth in year ended Mar 2026 is 6.63% vs 4.76% in Mar 2025
About CSB Bank Ltd

Company Coordinates


