
Compare Aditya Bir. Fas. with Similar Stocks
Dashboard
Weak Long Term Fundamental Strength with an average Return on Capital Employed (ROCE) of 0.93%
- Poor long term growth as Net Sales has grown by an annual rate of 9.27% and Operating profit at 2.05% over the last 5 years
- Low ability to service debt as the company has a high Debt to EBITDA ratio of 9.01 times
Flat results in Mar 26
Risky - Negative Operating Profits
Below par performance in long term as well as near term
Stock DNA
Garments & Apparels
INR 7,625 Cr (Small Cap)
NA (Loss Making)
73
0.00%
0.80
-12.61%
1.29
Total Returns (Price + Dividend) 
Aditya Bir. Fas. for the last several years.
Risk Adjusted Returns v/s
Returns Beta

News

Aditya Birla Fashion & Retail Ltd Sees Mixed Technical Signals Amid Price Momentum Shift
Aditya Birla Fashion & Retail Ltd (ABFRL) has experienced a notable shift in its technical parameters, reflecting a complex interplay between bullish and bearish signals. Despite a recent 5.49% intraday gain, the stock’s overall momentum remains cautiously subdued, with key indicators such as MACD, RSI, and moving averages presenting a nuanced outlook for investors navigating the garments and apparels sector.
Read full news article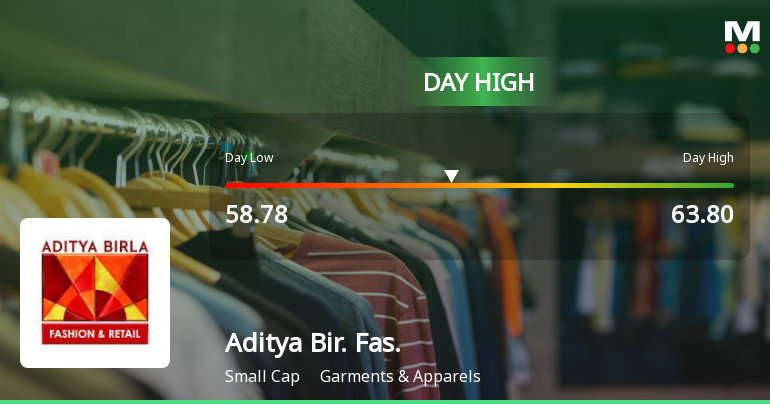
Aditya Birla Fashion & Retail Ltd Surges 8.18% to Day's High of Rs 62.22 — Outperforms Sector by 8.58 Percentage Points
The Sensex advanced 0.45% on 2 Jul 2026, yet Aditya Birla Fashion & Retail Ltd outpaced the broader market with an 8.18% gain, reaching an intraday high of Rs 62.22. This 8.58 percentage-point outperformance over the Retailing sector’s 2.88% decline highlights a distinctly stock-specific rally rather than a market-wide lift.
Read full news article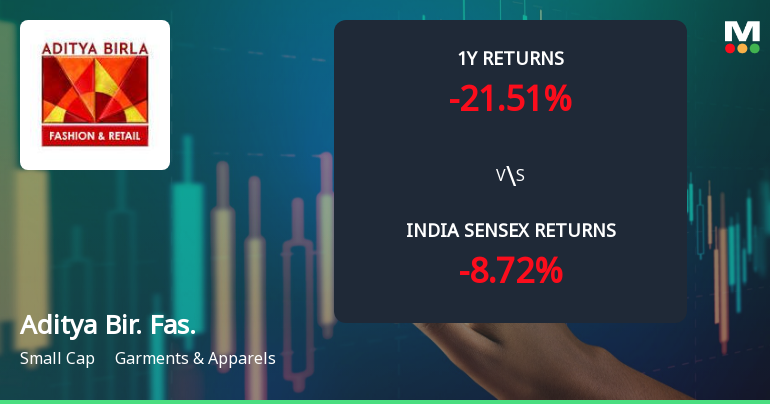
Aditya Birla Fashion & Retail Ltd Faces Bearish Momentum Amid Technical Deterioration
Aditya Birla Fashion & Retail Ltd (ABFRL) has experienced a notable shift in price momentum, with technical indicators signalling a bearish trend. The stock’s recent performance, combined with deteriorating moving averages and mixed signals from momentum oscillators, suggests mounting pressure on this small-cap garment and apparel player amid broader market challenges.
Read full news article Announcements
Aditya Birla Fashion and Retail Limited - ESOP/ESOS/ESPS
03-Dec-2019 | Source : NSEAditya Birla Fashion and Retail Limited has informed the Exchange regarding Grant of 4461261 Options.
Aditya Birla Fashion and Retail Limited - Analysts/Institutional Investor Meet/Con. Call Updates
22-Nov-2019 | Source : NSEAditya Birla Fashion and Retail Limiteded has informed the Exchange regarding Analysts/Institutional Investor Meet/Con. Call Updates
Aditya Birla Fashion and Retail Limited - Updates
13-Nov-2019 | Source : NSEAditya Birla Fashion and Retail Limited has informed the Exchange regarding 'allotment of 5,000 rated, listed, nonconvertible,redeemable, unsecured NCDs of ₹10,00,000 each aggregating to ₹ 500 Crore (Rupees Five Hundred Crore only), on private placement basis'.
Corporate Actions

No Upcoming Board Meetings

No Dividend history available

No Splits history available

No Bonus history available

Aditya Birla Fashion & Retail Ltd has announced 9:77 rights issue, ex-date: 30 Jun 20
Quality key factors
Valuation key factors
Technicals key factors
 Technical Indicator Scale: Bearish, Mildly Bearish, Sideways, Mildly Bullish, Bullish Turned
 Shareholding Snapshot : Mar 2026
Shareholding Compare (%holding)
Promoters
None
Held by 34 Schemes (5.61%)
Held by 182 FIIs (15.52%)
Birla Group Holdings Private Limited (17.4%)
Caladium Investment Pte. Ltd. (4.94%)
20.88%
Quarterly Results Snapshot (Consolidated) - Mar'26 - YoY

YoY Growth in quarter ended Mar 2026 is 15.74% vs 9.17% in Mar 2025

YoY Growth in quarter ended Mar 2026 is -779.67% vs 92.65% in Mar 2025
Half Yearly Results Snapshot (Consolidated) - Sep'25
Growth in half year ended Sep 2025 is 11.02% vs -46.52% in Sep 2024
Growth in half year ended Sep 2025 is -54.50% vs 4.04% in Sep 2024
Nine Monthly Results Snapshot (Consolidated) - Dec'25
YoY Growth in nine months ended Dec 2025 is 9.79% vs -46.78% in Dec 2024
YoY Growth in nine months ended Dec 2025 is -74.83% vs 9.91% in Dec 2024
Annual Results Snapshot (Consolidated) - Mar'26
YoY Growth in year ended Mar 2026 is 11.18% vs 14.18% in Mar 2025
YoY Growth in year ended Mar 2026 is -106.45% vs 40.16% in Mar 2025
About Aditya Birla Fashion & Retail Ltd

Company Coordinates


