
Compare AIA Engineering with Similar Stocks
Stock DNA
Castings & Forgings
INR 43,674 Cr (Small Cap)
34.00
37
0.35%
-0.55
15.86%
5.26
Total Returns (Price + Dividend) 
Latest dividend: 16 per share ex-dividend date: Sep-04-2025
Risk Adjusted Returns v/s
Returns Beta

News

AIA Engineering Ltd is Rated Buy
AIA Engineering Ltd is rated 'Buy' by MarketsMOJO, with this rating last updated on 26 May 2026. However, the analysis and financial metrics discussed here reflect the stock's current position as of 19 June 2026, providing investors with the latest insights into its performance and outlook.
Read full news article
AIA Engineering Ltd is Rated Buy
AIA Engineering Ltd is rated 'Buy' by MarketsMOJO, with this rating last updated on 26 May 2026. However, the analysis and financial metrics discussed below reflect the stock's current position as of 08 June 2026, providing investors with the most up-to-date insight into the company’s performance and outlook.
Read full news article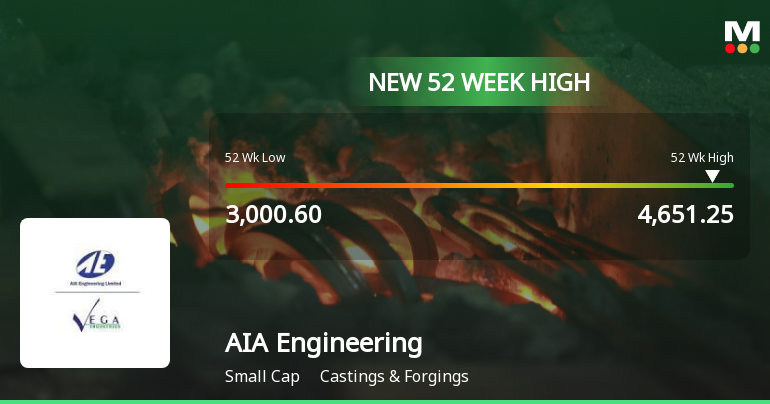
Broad-Based Technical Strength Lifts AIA Engineering Ltd to 52-Week High of Rs 4651.25
Surging to a fresh 52-week high of Rs 4651.25 on 1 Jun 2026, AIA Engineering Ltd has demonstrated robust price momentum, outpacing its sector and the broader market. This milestone caps a four-day rally that has delivered a 13.37% gain, underscoring the stock’s strong technical positioning amid a mixed market backdrop.
Read full news article Announcements
Announcement under Regulation 30 (LODR)-Newspaper Publication
06-Jun-2026 | Source : BSEPursuant to Regulation 47 of SEBI (Listing Obligations and Disclosure Requirements) Regulations 2015 we submit herewith the copies of newspaper advertisement published for Notice to Shareholders in respect of transfer of equity shares of the Company to Investor Education and Protection Fund in accordance with Rule 6 of Investor Education and Protection Fund Authority (Accounting Audit Transfer and Refund) Rules 2016 and amendments thereof.
Shareholder Meeting / Postal Ballot-Scrutinizers Report
29-May-2026 | Source : BSEWe submit herewith Scrutinizers Report of Tushar Vora & Associates on the Result of the Postal Ballot.
Shareholder Meeting / Postal Ballot-Outcome of Postal_Ballot
29-May-2026 | Source : BSEWe submit herewith the Result of Postal Ballot under Regulation 44(3) of SEBI (Listing Obligations and Disclosure Requirements) Regulations 2015
Corporate Actions

No Upcoming Board Meetings

AIA Engineering Ltd has declared 800% dividend, ex-date: 04 Sep 25

AIA Engineering Ltd has announced 2:10 stock split, ex-date: 13 Oct 08

No Bonus history available

No Rights history available
Quality key factors
Valuation key factors
Technicals key factors
 Technical Indicator Scale: Bearish, Mildly Bearish, Sideways, Mildly Bullish, Bullish Turned
 Shareholding Snapshot : Mar 2026
Shareholding Compare (%holding)
Promoters
None
Held by 27 Schemes (20.14%)
Held by 219 FIIs (16.79%)
Bhadresh Kantilal Shah (58.47%)
Nalanda India Equity Fund Limited (9.29%)
2.15%
Quarterly Results Snapshot (Consolidated) - Mar'26 - YoY

YoY Growth in quarter ended Mar 2026 is 9.44% vs 0.59% in Mar 2025
YoY Growth in quarter ended Mar 2026 is 37.88% vs 9.47% in Mar 2025
Half Yearly Results Snapshot (Consolidated) - Sep'25
Growth in half year ended Sep 2025 is 1.09% vs -18.55% in Sep 2024
Growth in half year ended Sep 2025 is 12.81% vs -13.29% in Sep 2024
Nine Monthly Results Snapshot (Consolidated) - Dec'25
YoY Growth in nine months ended Dec 2025 is 0.74% vs -15.48% in Dec 2024
YoY Growth in nine months ended Dec 2025 is 13.07% vs -11.37% in Dec 2024
Annual Results Snapshot (Consolidated) - Mar'26
YoY Growth in year ended Mar 2026 is 3.09% vs -11.67% in Mar 2025
YoY Growth in year ended Mar 2026 is 19.74% vs -6.59% in Mar 2025
About AIA Engineering Ltd

Company Coordinates


