
Compare Happy Forgings with Similar Stocks
Dashboard
Company has a Debt to Equity ratio (avg) of 0.01 times
Poor long term growth as Net Sales has grown by an annual rate of 6.70% and Operating profit at 8.95% over the last 5 years
The company has declared Positive results for the last 3 consecutive quarters
With ROE of 14.2, it has a Very Expensive valuation with a 6.8 Price to Book Value
MFs have increased holdings this quarter and now hold 14.63% of the company
Market Beating Performance
Stock DNA
Castings & Forgings
INR 14,646 Cr (Small Cap)
48.00
37
0.19%
0.02
14.17%
6.83
Total Returns (Price + Dividend) 
Latest dividend: 3 per share ex-dividend date: Jul-22-2025
Risk Adjusted Returns v/s
Returns Beta

News
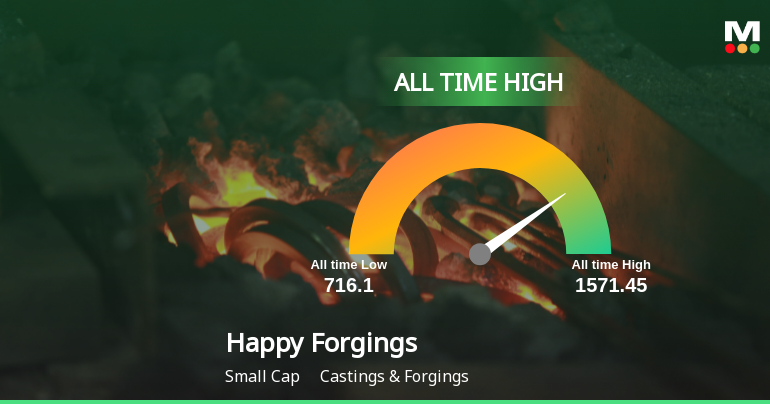
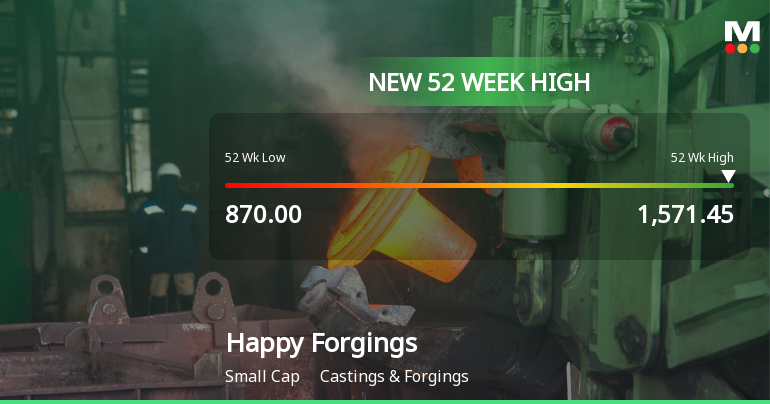
Broad-Based Technical Strength Lifts Happy Forgings Ltd to 52-Week High of Rs 1570.05
Surging to a fresh 52-week and all-time high of Rs 1570.05 on 23 Jun 2026, Happy Forgings Ltd has demonstrated remarkable price momentum, outperforming its sector and the broader market with a 17.47% gain over the past five trading sessions.
Read full news article
Broad-Based Technical Strength Lifts Happy Forgings Ltd to 52-Week High of Rs 1517.6
With a sustained rally pushing Happy Forgings Ltd to a new 52-week and all-time high of Rs 1517.6 on 22 Jun 2026, the stock has demonstrated remarkable price momentum, outpacing its sector and the broader market over the past year.
Read full news article Announcements
Announcement under Regulation 30 (LODR)-Allotment of ESOP / ESPS
17-Jun-2026 | Source : BSEIntimation of allotment of ESOP
Announcement under Regulation 30 (LODR)-Earnings Call Transcript
28-May-2026 | Source : BSEEarnings call Transcript
Copy Of Financial Results For The Period Ended 31St March 2026 Submitted On 21St May 2026 In Legible Form
23-May-2026 | Source : BSECopy of financial results for the period ended 31st March 2026 in legible form
Corporate Actions

No Upcoming Board Meetings

Happy Forgings Ltd has declared 200% dividend, ex-date: 20 Jul 26

No Splits history available

No Bonus history available

No Rights history available
Quality key factors
Valuation key factors
Technicals key factors
 Technical Indicator Scale: Bearish, Mildly Bearish, Sideways, Mildly Bullish, Bullish Turned
 Shareholding Snapshot : Mar 2026
Shareholding Compare (%holding)
Promoters
None
Held by 10 Schemes (14.63%)
Held by 40 FIIs (1.73%)
Paritosh Kumar (40.33%)
Sbi Small Cap Fund (5.62%)
2.79%
Quarterly Results Snapshot (Consolidated) - Mar'26 - QoQ

QoQ Growth in quarter ended Mar 2026 is 8.31% vs 3.69% in Dec 2025

QoQ Growth in quarter ended Mar 2026 is 5.85% vs 7.49% in Dec 2025
Half Yearly Results Snapshot (Consolidated) - Sep'25
Growth in half year ended Sep 2025 is 4.07% vs 4.41% in Sep 2024
Growth in half year ended Sep 2025 is 2.92% vs 13.30% in Sep 2024
Nine Monthly Results Snapshot (Consolidated) - Dec'25
YoY Growth in nine months ended Dec 2025 is 6.20% vs 4.14% in Dec 2024
YoY Growth in nine months ended Dec 2025 is 9.18% vs 12.71% in Dec 2024
Annual Results Snapshot (Consolidated) - Mar'26
YoY Growth in year ended Mar 2026 is 9.76% vs 3.73% in Mar 2025
YoY Growth in year ended Mar 2026 is 12.78% vs 10.07% in Mar 2025
About Happy Forgings Ltd

Company Coordinates


