
Compare Bajaj Holdings with Similar Stocks
Stock DNA
Holding Company
INR 118,648 Cr (Large Cap)
14.00
22
1.82%
0.00
11.21%
1.63
Total Returns (Price + Dividend) 
Latest dividend: 49.92355459378087 per share ex-dividend date: Jun-30-2026
Risk Adjusted Returns v/s
Returns Beta

News
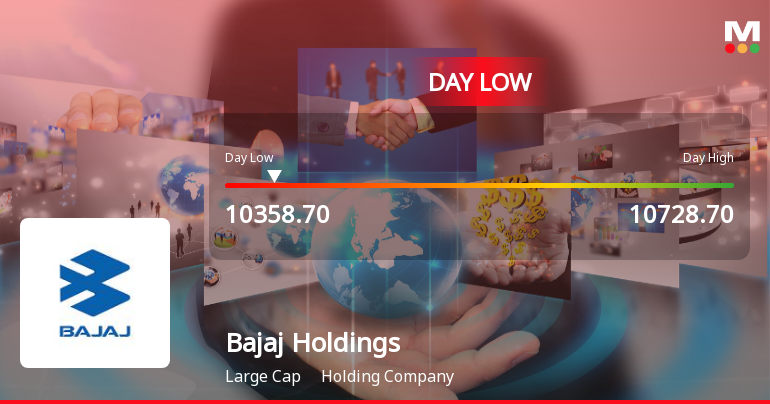
Bajaj Holdings & Investment Ltd Hits Intraday Low Amid Price Pressure
Bajaj Holdings & Investment Ltd experienced a notable intraday decline on 08 Jul 2026, touching a low of Rs 10,400 as the stock faced significant price pressure amid a broadly negative market environment. The share price fell by 3.69% during the day, underperforming its sector and the benchmark Sensex index.
Read full news article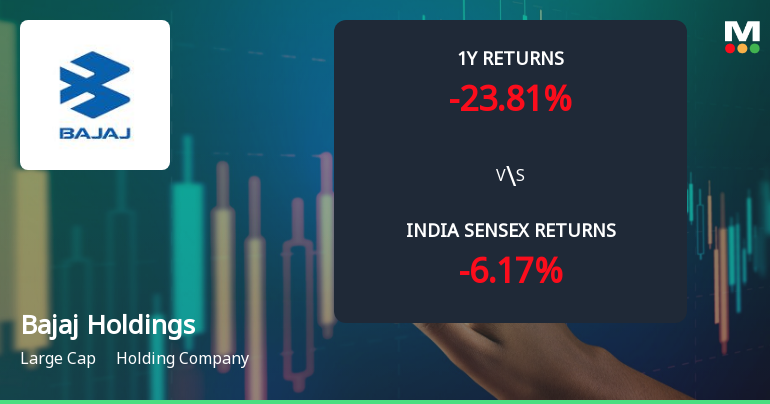
Bajaj Holdings & Investment Ltd: Technical Momentum Shifts Amid Mixed Indicator Signals
Bajaj Holdings & Investment Ltd has experienced a notable shift in its technical momentum, reflecting a complex interplay of bullish and bearish signals across key indicators. Despite a recent downgrade in technical trend from sideways to mildly bearish, the stock’s mixed technical readings suggest cautious optimism for investors navigating the holding company sector.
Read full news article
Bajaj Holdings & Investment Ltd Upgraded to Hold by MarketsMOJO on Technical and Valuation Grounds
Bajaj Holdings & Investment Ltd has seen its investment rating upgraded from Sell to Hold, reflecting a notable improvement in technical indicators alongside steady long-term fundamental strength. The revised rating, effective from 03 July 2026, is underpinned by a shift in technical trends, valuation metrics, financial performance, and quality assessments, signalling a more balanced outlook for this large-cap holding company.
Read full news article Announcements
Bajaj Holdings & Investment Limited - Updates
09-Dec-2019 | Source : NSEBajaj Holdings & Investment Limited has informed the Exchange regarding 'Name change of Share Transfer Agent from Karvy Fintech Private Limited to
Bajaj Holdings & Investment Limited - Other General Purpose
21-Nov-2019 | Source : NSEBajaj Holdings & Investment Limited has informed Exchange regarding disclosure of related party transactions, on a consolidated basis, for the half year ended September 30, 2019.
Bajaj Holdings & Investment Limited - Outcome of Board Meeting
23-Oct-2019 | Source : NSEBajaj Holdings & Investment Limited has informed the Exchange regarding Board meeting held on October 23, 2019.
Corporate Actions

No Upcoming Board Meetings

Bajaj Holdings & Investment Ltd has declared 800% dividend, ex-date: 30 Jun 26

No Splits history available

No Bonus history available

No Rights history available
Quality key factors
Valuation key factors
Technicals key factors
 Technical Indicator Scale: Bearish, Mildly Bearish, Sideways, Mildly Bullish, Bullish Turned
 Shareholding Snapshot : Mar 2026
Shareholding Compare (%holding)
Promoters
0.0006
Held by 35 Schemes (6.9%)
Held by 564 FIIs (9.62%)
Jamnalal Sons Pvt Ltd (18.01%)
Parag Parikh Flexi Cap Fund (5.73%)
11.93%
Quarterly Results Snapshot (Consolidated) - Mar'26 - QoQ

QoQ Growth in quarter ended Mar 2026 is -78.94% vs -27.56% in Dec 2025
QoQ Growth in quarter ended Mar 2026 is 27.71% vs 29.33% in Dec 2025
Half Yearly Results Snapshot (Consolidated) - Sep'25

Growth in half year ended Sep 2025 is 74.78% vs 25.56% in Sep 2024
Growth in half year ended Sep 2025 is 65.60% vs 4.82% in Sep 2024
Nine Monthly Results Snapshot (Consolidated) - Dec'25
YoY Growth in nine months ended Dec 2025 is 87.15% vs 23.42% in Dec 2024
YoY Growth in nine months ended Dec 2025 is 47.27% vs 5.36% in Dec 2024
Annual Results Snapshot (Consolidated) - Mar'26
YoY Growth in year ended Mar 2026 is 56.28% vs -58.49% in Mar 2025
YoY Growth in year ended Mar 2026 is 47.79% vs -10.27% in Mar 2025
About Bajaj Holdings & Investment Ltd

Company Coordinates


