
Compare Capillary Tech. with Similar Stocks
Stock DNA
Computers - Software & Consulting
INR 4,204 Cr (Small Cap)
103.00
20
0.00%
-0.42
2.68%
3.87
Total Returns (Price + Dividend) 
Capillary Tech. for the last several years.
Risk Adjusted Returns v/s
Returns Beta

News
Capillary Technologies India Ltd Surges 7.18% to Day's High of Rs 534 — Outperforms Sector by 4.23 Percentage Points
The Sensex gained 1.18% on 12 Jun 2026, yet Capillary Technologies India Ltd outpaced the broader market with a 7.18% rally, reaching an intraday peak of Rs 534. This 4.23-percentage-point outperformance over its sector signals a distinctly stock-specific momentum shift rather than a mere market tailwind.
Read full news article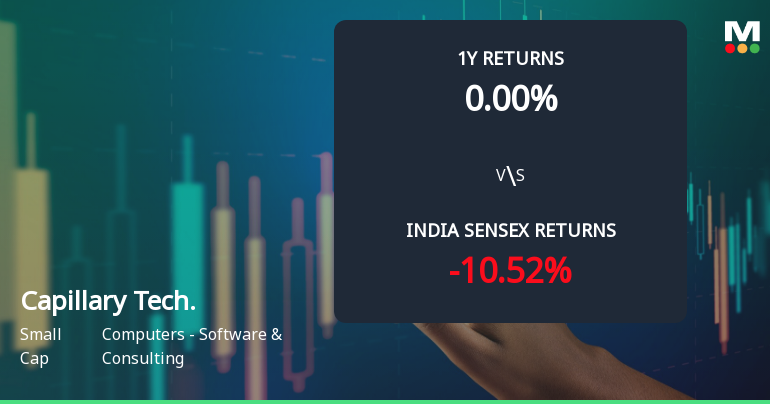
Capillary Technologies India Ltd Faces Mildly Bearish Momentum Amid Technical Downgrade
Capillary Technologies India Ltd, a small-cap player in the Computers - Software & Consulting sector, has experienced a notable shift in its technical momentum, transitioning from a sideways trend to a mildly bearish stance. This change is underscored by mixed signals from key technical indicators such as MACD, RSI, Bollinger Bands, and moving averages, reflecting growing investor caution amid recent price declines and underperformance relative to the broader market.
Read full news article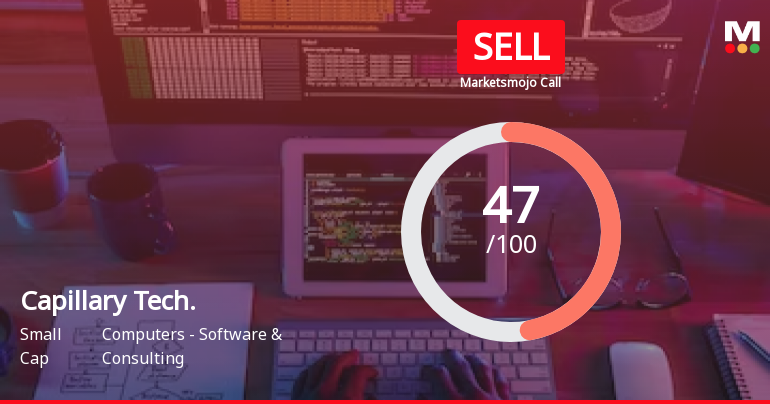
Capillary Technologies India Ltd is Rated Sell
Capillary Technologies India Ltd is rated 'Sell' by MarketsMOJO, with this rating last updated on 11 May 2026. However, the analysis and financial metrics discussed here reflect the stock's current position as of 09 June 2026, providing investors with the latest insights into the company’s fundamentals, valuation, financial trends, and technical outlook.
Read full news article Announcements
Intimation Under Regulation 30 Of Securities And Exchange Board Of India (Listing Obligations And Disclosure Requirements) Regulations 2015 (The Listing Regulations) - Participation In Investor Conference
10-Jun-2026 | Source : BSEWe wish to inform you that the Company through its representative will be participating in the investor conference.
Intimation Of Fixation Of Date Of 14Th Annual General Meeting (AGM) Of The Capillary Technologies India Limited
29-May-2026 | Source : BSEWe wish to inform you that Board of Directors in its meetng held today has approved tp hold the 14th AGM of the Company on Friday August 28 2026.
Announcement under Regulation 30 (LODR)-Change in Management
29-May-2026 | Source : BSEResignation of Mr. Ravi Jaswani Head - Finance designated as SMP of the Company
Corporate Actions

No Upcoming Board Meetings

No Dividend history available

No Splits history available

No Bonus history available

No Rights history available
Quality key factors
Valuation key factors
Technicals key factors
 Technical Indicator Scale: Bearish, Mildly Bearish, Sideways, Mildly Bullish, Bullish Turned
 Shareholding Snapshot : Mar 2026
Shareholding Compare (%holding)
Promoters
None
Held by 13 Schemes (14.02%)
Held by 20 FIIs (3.43%)
Capillary Technologies International Pte Ltd (49.7%)
Ronal Holdings Llc (6.96%)
4.72%
Quarterly Results Snapshot (Standalone) - Mar'26 - QoQ

QoQ Growth in quarter ended Mar 2026 is 12.14% vs 24.53% in Dec 2025

QoQ Growth in quarter ended Mar 2026 is 842.86% vs 135.71% in Dec 2025
Half Yearly Results Snapshot (Consolidated) - Sep'25
Not Applicable: The company has declared_date for only one period
Not Applicable: The company has declared_date for only one period
Nine Monthly Results Snapshot (Consolidated) - Dec'25
Not Applicable: The company has declared_date for only one period
Not Applicable: The company has declared_date for only one period
Annual Results Snapshot (Consolidated) - Mar'26
YoY Growth in year ended Mar 2026 is 22.79% vs 13.93% in Mar 2025
YoY Growth in year ended Mar 2026 is 294.50% vs 122.36% in Mar 2025
About Capillary Technologies India Ltd

Company Coordinates


