
Compare Carysil with Similar Stocks
Stock DNA
Electronics & Appliances
INR 3,345 Cr (Small Cap)
34.00
30
0.21%
0.35
16.27%
5.45
Total Returns (Price + Dividend) 
Latest dividend: 2.4 per share ex-dividend date: Sep-17-2025
Risk Adjusted Returns v/s
Returns Beta

News
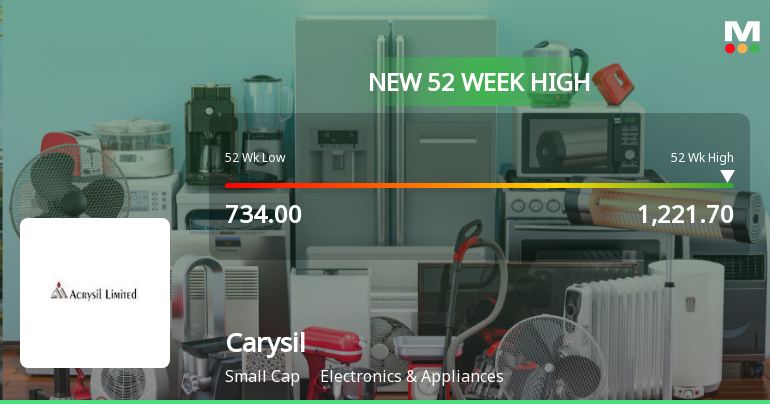
Broad-Based Technical Strength Lifts Carysil Ltd to 52-Week High of Rs 1221.7
With a decisive break above Rs 1220, Carysil Ltd has reached a fresh 52-week high on 11 Jun 2026, extending its recent winning streak to three consecutive days and delivering a 14.39% gain over this period. This milestone comes amid a backdrop of broad technical alignment and sustained price momentum, setting the stock apart in a market where the Sensex is under pressure.
Read full news article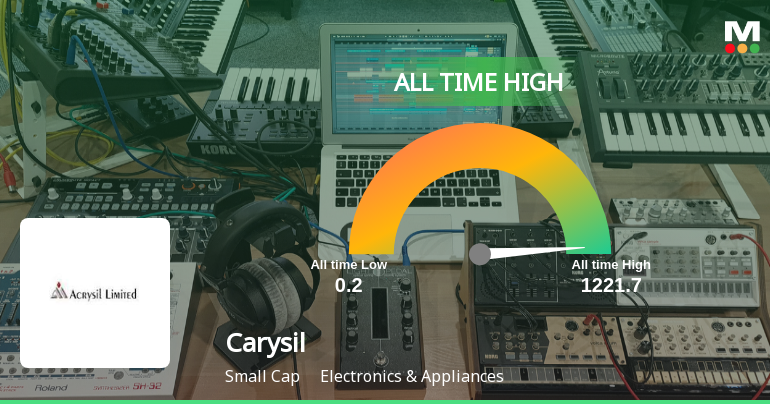
Carysil Ltd Hits All-Time High of Rs 1,221.7 as Momentum Builds Across Timeframes
Extending its winning streak to three sessions, Carysil Ltd surged to a fresh all-time high of Rs 1,221.7 on 11 Jun 2026, outperforming its sector and the broader market with a 1.14% gain on the day against a 0.53% decline in the Sensex.
Read full news article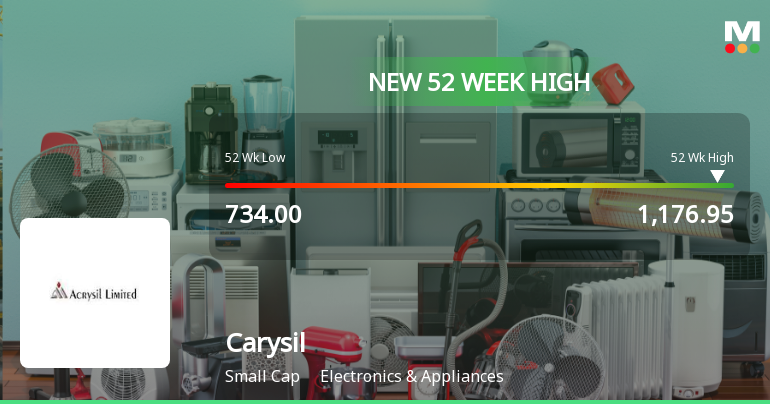
Broad-Based Technical Strength Lifts Carysil Ltd to 52-Week High of Rs 1176.95
Surging to an all-time high of Rs 1176.95 on 10 Jun 2026, Carysil Ltd has demonstrated robust momentum, outpacing its sector and the broader market with a 27.07% gain over the past year. This milestone caps a sustained rally fuelled by a confluence of bullish technical indicators and steady fundamental performance.
Read full news article Announcements
Announcement under Regulation 30 (LODR)-Restructuring
09-Jun-2026 | Source : BSERestructuring
Announcement under Regulation 30 (LODR)-Analyst / Investor Meet - Intimation
08-Jun-2026 | Source : BSEAnalyst/ Investor Meet
General Update
01-Jun-2026 | Source : BSEUpdate
Corporate Actions

No Upcoming Board Meetings

Carysil Ltd has declared 120% dividend, ex-date: 17 Sep 25

Carysil Ltd has announced 2:10 stock split, ex-date: 10 Jan 19

Carysil Ltd has announced 1:2 bonus issue, ex-date: 27 Sep 12

No Rights history available
Quality key factors
Valuation key factors
Technicals key factors
 Technical Indicator Scale: Bearish, Mildly Bearish, Sideways, Mildly Bullish, Bullish Turned
 Shareholding Snapshot : Mar 2026
Shareholding Compare (%holding)
Non Institution
None
Held by 3 Schemes (3.83%)
Held by 42 FIIs (1.59%)
Chirag Parekh (30.35%)
Abakkus Emerging Opportunities Fund-1 (5.34%)
37.02%
Quarterly Results Snapshot (Consolidated) - Mar'26 - QoQ

QoQ Growth in quarter ended Mar 2026 is 5.01% vs -7.52% in Dec 2025
QoQ Growth in quarter ended Mar 2026 is 28.56% vs -22.47% in Dec 2025
Half Yearly Results Snapshot (Consolidated) - Sep'25

Growth in half year ended Sep 2025 is 14.55% vs 33.74% in Sep 2024
Growth in half year ended Sep 2025 is 53.12% vs 20.83% in Sep 2024
Nine Monthly Results Snapshot (Consolidated) - Dec'25
YoY Growth in nine months ended Dec 2025 is 12.90% vs 23.96% in Dec 2024
YoY Growth in nine months ended Dec 2025 is 57.42% vs 6.58% in Dec 2024
Annual Results Snapshot (Consolidated) - Mar'26
YoY Growth in year ended Mar 2026 is 13.29% vs 19.28% in Mar 2025
YoY Growth in year ended Mar 2026 is 54.05% vs 10.11% in Mar 2025
About Carysil Ltd

Company Coordinates


