
Compare CMS Info Systems with Similar Stocks
Stock DNA
Diversified Commercial Services
INR 4,842 Cr (Small Cap)
16.00
20
0.93%
-0.09
12.76%
1.97
Total Returns (Price + Dividend) 
Latest dividend: 2.7000000000000006 per share ex-dividend date: Feb-18-2026
Risk Adjusted Returns v/s
Returns Beta

News
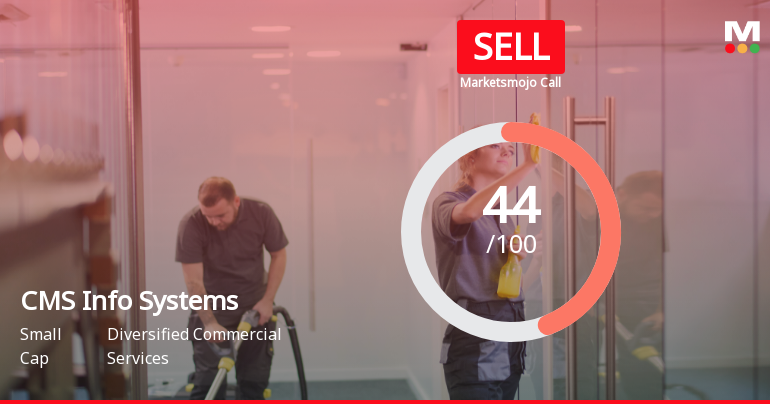
MarketsMOJO Downgrades CMS Info Systems Ltd to Sell Amid Weak Technicals and Financial Trends
CMS Info Systems Ltd has been downgraded from a Hold to a Sell rating following a comprehensive reassessment of its quality, valuation, financial trend, and technical indicators. The downgrade reflects deteriorating technical signals, flat recent financial performance, and subdued long-term growth prospects, despite some strengths in management efficiency and balance sheet health.
Read full news article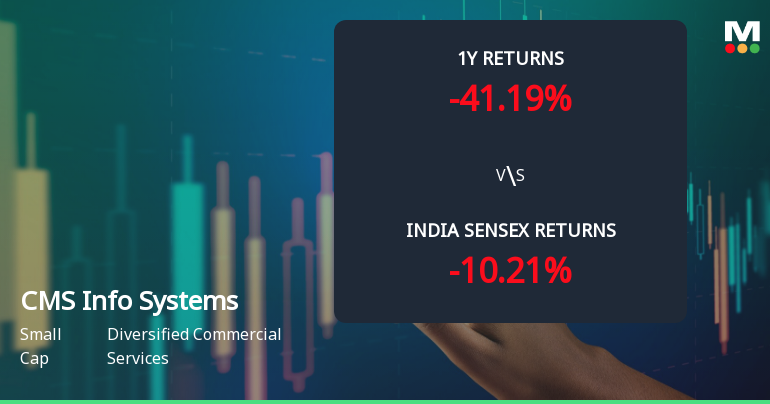
CMS Info Systems Ltd Faces Bearish Momentum Amid Technical Downgrade
CMS Info Systems Ltd, a small-cap player in the diversified commercial services sector, has experienced a notable shift in its technical momentum, signalling increased bearishness. Recent technical indicators reveal a deteriorating trend, with the company’s stock price retreating to ₹291.00, down 1.27% from the previous close of ₹294.75, reflecting mounting selling pressure amid broader market challenges.
Read full news article
CMS Info Systems Ltd is Rated Hold
CMS Info Systems Ltd is rated 'Hold' by MarketsMOJO, with this rating last updated on 27 May 2026. However, the analysis and financial metrics discussed here reflect the stock's current position as of 08 June 2026, providing investors with an up-to-date view of the company’s fundamentals, returns, and market standing.
Read full news article Announcements
Announcement under Regulation 30 (LODR)-Analyst / Investor Meet - Intimation
04-Jun-2026 | Source : BSEPursuant to Regulation 30 of SEBI (Listing Obligations and Disclosure Requirements) Regulations 2015 (SEBI Listing Regulations) - Intimation for Schedule of Analysts or Institutional Investors Meet
Clarificatory Letter From Mr. Rajiv Kaul Exec VC & CEO - Intention To Participate In The Ongoing Buyback
03-Jun-2026 | Source : BSEPlease find enclosed herewith the Clarificatory letter from Mr. Rajiv Kaul Exec VC & CEO - Intention to participate in the ongoing Buyback
Announcement under Regulation 30 (LODR)-Newspaper Publication
27-May-2026 | Source : BSEThe Company submits herewith Newspaper Publication of opening of Buyback Offer and completion of dispatch of Letter of Offer for Buyback of equity shares.
Corporate Actions

No Upcoming Board Meetings

CMS Info Systems Ltd has declared 27% dividend, ex-date: 18 Feb 26

No Splits history available

No Bonus history available

No Rights history available
Quality key factors
Valuation key factors
Technicals key factors
 Technical Indicator Scale: Bearish, Mildly Bearish, Sideways, Mildly Bullish, Bullish Turned
 Shareholding Snapshot : Mar 2026
Shareholding Compare (%holding)
Non Institution
None
Held by 16 Schemes (29.14%)
Held by 153 FIIs (24.97%)
None
Sbi Small Cap Fund (9.11%)
25.6%
Quarterly Results Snapshot (Consolidated) - Mar'26 - QoQ

QoQ Growth in quarter ended Mar 2026 is 2.38% vs 1.58% in Dec 2025
QoQ Growth in quarter ended Mar 2026 is 37.74% vs -21.75% in Dec 2025
Half Yearly Results Snapshot (Consolidated) - Sep'25

Growth in half year ended Sep 2025 is 0.99% vs 15.98% in Sep 2024
Growth in half year ended Sep 2025 is -8.13% vs 7.74% in Sep 2024
Nine Monthly Results Snapshot (Consolidated) - Dec'25
YoY Growth in nine months ended Dec 2025 is 2.70% vs 10.25% in Dec 2024
YoY Growth in nine months ended Dec 2025 is -18.39% vs 7.50% in Dec 2024
Annual Results Snapshot (Consolidated) - Mar'26
YoY Growth in year ended Mar 2026 is 2.58% vs 7.06% in Mar 2025
YoY Growth in year ended Mar 2026 is -18.54% vs 7.29% in Mar 2025
About CMS Info Systems Ltd

Company Coordinates


