
Compare CreditAcc. Gram. with Similar Stocks
Total Returns (Price + Dividend) 
Latest dividend: 10 per share ex-dividend date: Jul-26-2024
Risk Adjusted Returns v/s
Returns Beta

News

CreditAccess Grameen Ltd is Rated Buy
CreditAccess Grameen Ltd is rated 'Buy' by MarketsMOJO, with this rating last updated on 12 June 2026. However, the analysis and financial metrics discussed here reflect the stock's current position as of 07 July 2026, providing investors with the latest insights into its performance and outlook.
Read full news article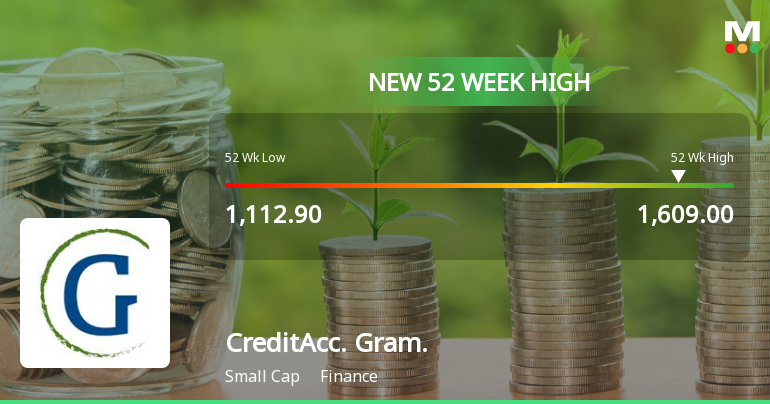
Broad-Based Technical Strength Lifts CreditAccess Grameen Ltd to 52-Week High of Rs 1609
With a sustained five-day rally culminating in a fresh 52-week high of Rs 1609 on 6 Jul 2026, CreditAccess Grameen Ltd has demonstrated robust price momentum that outpaces its sector and the broader market.
Read full news article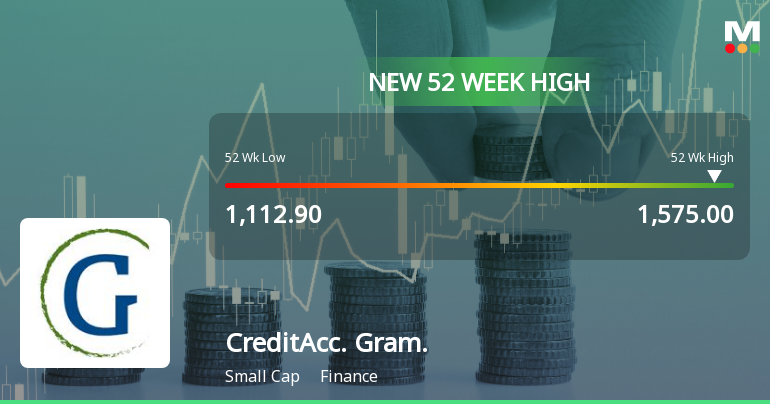
Broad-Based Technical Strength Lifts CreditAccess Grameen Ltd to 52-Week High of Rs 1575
Surging past its previous peaks, CreditAccess Grameen Ltd touched a fresh 52-week high of Rs 1575 on 3 Jul 2026, propelled by a confluence of robust technical indicators and sustained price momentum.
Read full news article Announcements
CREDITACCESS GRAMEEN LIMITED - Acquisition
05-Dec-2019 | Source : NSECREDITACCESS GRAMEEN LIMITED has informed the Exchange about Acquisition of Madura Micro Finance Limited- Update
CREDITACCESS GRAMEEN LIMITED - Analysts/Institutional Investor Meet/Con. Call Updates
28-Nov-2019 | Source : NSECREDITACCESS GRAMEEN LIMITED has informed the Exchange regarding Analysts/Institutional Investor Meet/Con. Call Updates
CREDITACCESS GRAMEEN LIMITED - Other General Purpose
18-Nov-2019 | Source : NSECREDITACCESS GRAMEEN LIMITED has informed the Exchange that Pursuant to Regulation 23(9) of the SEBI (Listing Obligation and Disclosure Requirements), Regulations, 2018 the Company has submitted a copy of disclosure of the Related Party Transactions on standalone basis for the period ended September 30, 2019, drawn in accordance with applicable Accounting Standards.
Corporate Actions

No Upcoming Board Meetings

CreditAccess Grameen Ltd has declared 100% dividend, ex-date: 26 Jul 24

No Splits history available

No Bonus history available

No Rights history available
Quality key factors
Valuation key factors
Technicals key factors
 Technical Indicator Scale: Bearish, Mildly Bearish, Sideways, Mildly Bullish, Bullish Turned
 Shareholding Snapshot : Mar 2026
Shareholding Compare (%holding)
Promoters
None
Held by 29 Schemes (9.95%)
Held by 153 FIIs (12.94%)
Creditaccess India B.v. (66.24%)
Government Pension Fund Global (1.85%)
6.72%
Quarterly Results Snapshot (Consolidated) - Mar'26 - QoQ

QoQ Growth in quarter ended Mar 2026 is 7.17% vs -1.19% in Dec 2025

QoQ Growth in quarter ended Mar 2026 is 34.69% vs 100.37% in Dec 2025
Half Yearly Results Snapshot (Consolidated) - Sep'25
Growth in half year ended Sep 2025 is 0.20% vs 22.69% in Sep 2024
Growth in half year ended Sep 2025 is -68.14% vs -16.07% in Sep 2024
Nine Monthly Results Snapshot (Consolidated) - Dec'25
YoY Growth in nine months ended Dec 2025 is 2.67% vs 17.16% in Dec 2024
YoY Growth in nine months ended Dec 2025 is -9.52% vs -53.84% in Dec 2024
Annual Results Snapshot (Consolidated) - Mar'26
YoY Growth in year ended Mar 2026 is 5.33% vs 11.34% in Mar 2025
YoY Growth in year ended Mar 2026 is 46.34% vs -63.25% in Mar 2025
About CreditAccess Grameen Ltd

Company Coordinates


