
Compare CSB Bank with Similar Stocks
Dashboard
The Bank has a high Capital Adequacy Ratio of 22.57% signifying high buffers against its risk based assets
Healthy long term growth as Net profit has grown by an annual rate of 23.72%
The company has declared Positive results for the last 3 consecutive quarters
With ROA of 1.1, it has a Attractive valuation with a 1.3 Price to Book Value
High Institutional Holdings at 28.06%
Total Returns (Price + Dividend) 
CSB Bank for the last several years.
Risk Adjusted Returns v/s
Returns Beta

News
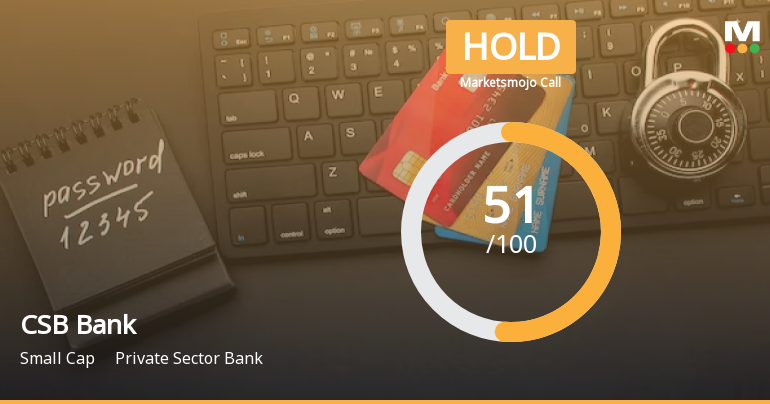
CSB Bank Ltd Upgraded to Hold by MarketsMOJO on Improved Valuation and Financial Metrics
CSB Bank Ltd has seen its investment rating upgraded from Sell to Hold as of 9 June 2026, reflecting significant improvements in valuation and financial performance. The bank’s very attractive valuation, robust capital adequacy, and steady financial trends underpin this positive reassessment despite recent underperformance relative to benchmarks.
Read full news article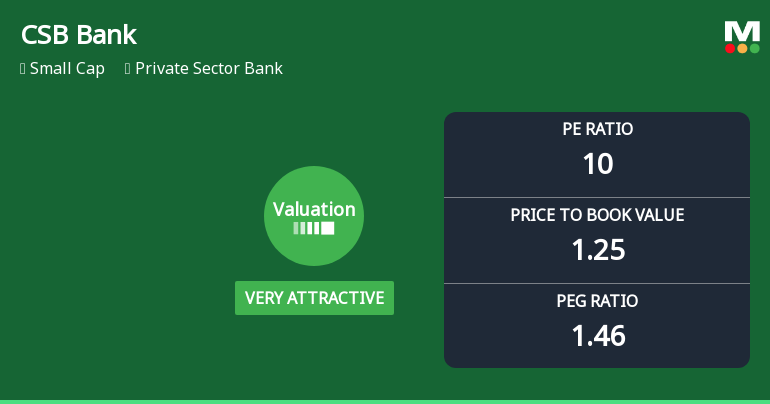
CSB Bank Ltd Valuation Shifts Signal Renewed Price Attractiveness Amid Sector Challenges
CSB Bank Ltd has witnessed a significant shift in its valuation parameters, moving from an attractive to a very attractive rating, driven primarily by its low price-to-earnings (P/E) and price-to-book value (P/BV) ratios relative to peers and historical averages. Despite recent underperformance against the Sensex, the bank’s improved valuation metrics and stable fundamentals suggest a compelling investment case for discerning investors.
Read full news article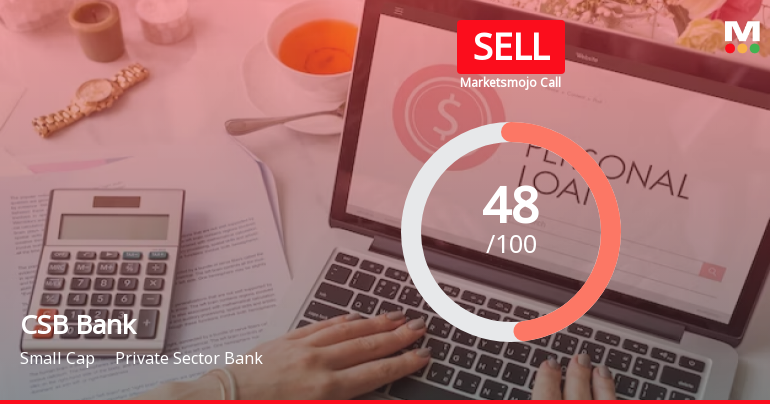
CSB Bank Ltd is Rated Sell by MarketsMOJO
CSB Bank Ltd is rated 'Sell' by MarketsMOJO, with this rating last updated on 27 March 2026. However, the analysis and financial metrics discussed here reflect the stock's current position as of 04 June 2026, providing investors with an up-to-date view of the company’s fundamentals, valuation, financial trends, and technical outlook.
Read full news article Announcements
Announcement under Regulation 30 (LODR)-Analyst / Investor Meet - Outcome
11-Jun-2026 | Source : BSEParticipation in the Analyst/Institutional Investor Meeting held on June 11 2026
Transfer Of Equity Shares From CSB ESOS Trust
11-Jun-2026 | Source : BSETransfer of Equity Shares from CSB ESOS Trust
Announcement under Regulation 30 (LODR)-Analyst / Investor Meet - Outcome
05-Jun-2026 | Source : BSEParticipation in the Analyst/Institutional Investor Meeting held on June 5 2026
Corporate Actions

No Upcoming Board Meetings

No Dividend history available

No Splits history available

No Bonus history available

No Rights history available
Quality key factors
Valuation key factors
Technicals key factors
 Technical Indicator Scale: Bearish, Mildly Bearish, Sideways, Mildly Bullish, Bullish Turned
 Shareholding Snapshot : Mar 2026
Shareholding Compare (%holding)
Promoters
None
Held by 14 Schemes (12.34%)
Held by 95 FIIs (12.84%)
Fih Mauritius Investments Ltd (40.0%)
Sbi Small Cap Fund (6.34%)
19.17%
Quarterly Results Snapshot (Standalone) - Mar'26 - QoQ

QoQ Growth in quarter ended Mar 2026 is 4.04% vs 4.06% in Dec 2025

QoQ Growth in quarter ended Mar 2026 is 32.04% vs -4.78% in Dec 2025
Half Yearly Results Snapshot (Standalone) - Sep'25
Growth in half year ended Sep 2025 is 26.71% vs 23.78% in Sep 2024
Growth in half year ended Sep 2025 is 10.81% vs -5.15% in Sep 2024
Nine Monthly Results Snapshot (Standalone) - Dec'25
YoY Growth in nine months ended Dec 2025 is 26.3% vs 22.68% in Dec 2024
YoY Growth in nine months ended Dec 2025 is 7.00% vs -2.89% in Dec 2024
Annual Results Snapshot (Standalone) - Mar'26
YoY Growth in year ended Mar 2026 is 25.24% vs 22.87% in Mar 2025
YoY Growth in year ended Mar 2026 is 6.63% vs 4.76% in Mar 2025
About CSB Bank Ltd

Company Coordinates


