
Compare Electrost.Cast. with Similar Stocks
Dashboard
Weak Long Term Fundamental Strength with a -10.91% CAGR growth in Operating Profits over the last 5 years
- The company has been able to generate a Return on Equity (avg) of 9.03% signifying low profitability per unit of shareholders funds
The company has declared Negative results for the last 6 consecutive quarters
Below par performance in long term as well as near term
Stock DNA
Iron & Steel Products
INR 4,383 Cr (Small Cap)
22.00
45
2.01%
0.12
3.37%
0.73
Total Returns (Price + Dividend) 
Latest dividend: 1.4 per share ex-dividend date: Aug-14-2025
Risk Adjusted Returns v/s
Returns Beta

News
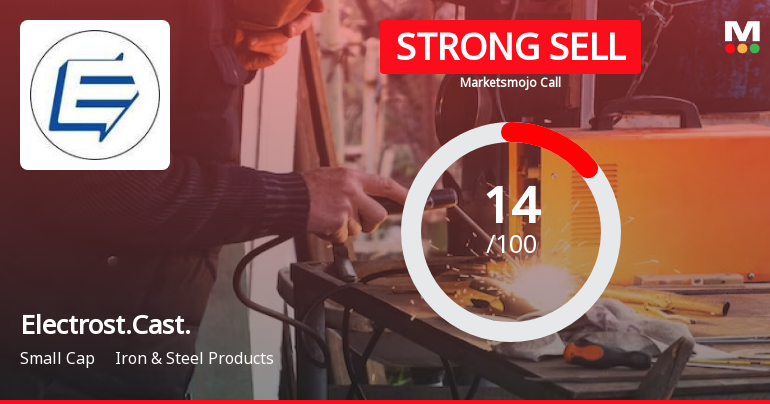
Electrosteel Castings Ltd is Rated Strong Sell
Electrosteel Castings Ltd is rated Strong Sell by MarketsMOJO. This rating was last updated on 19 May 2026. However, the analysis and financial metrics presented here reflect the stock’s current position as of 11 June 2026, providing investors with the latest insights into the company’s performance and outlook.
Read full news article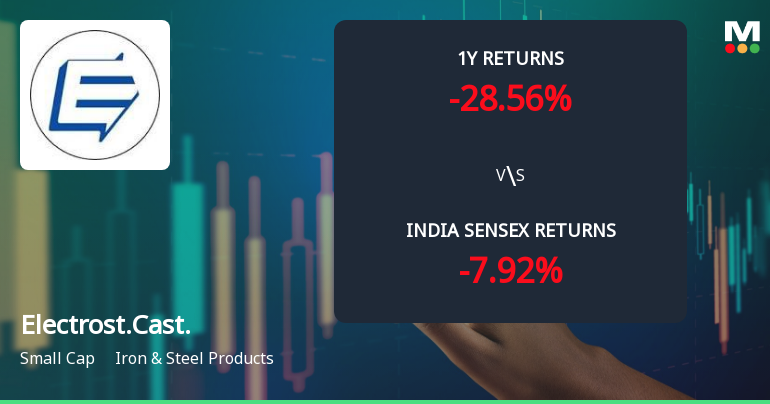
Electrosteel Castings Ltd Faces Bearish Momentum Amid Technical Downturn
Electrosteel Castings Ltd, a small-cap player in the Iron & Steel Products sector, has experienced a notable shift in its technical momentum, with key indicators signalling a bearish trend. Despite a strong long-term return profile, recent price action and technical parameters suggest caution for investors as the stock navigates a challenging phase.
Read full news article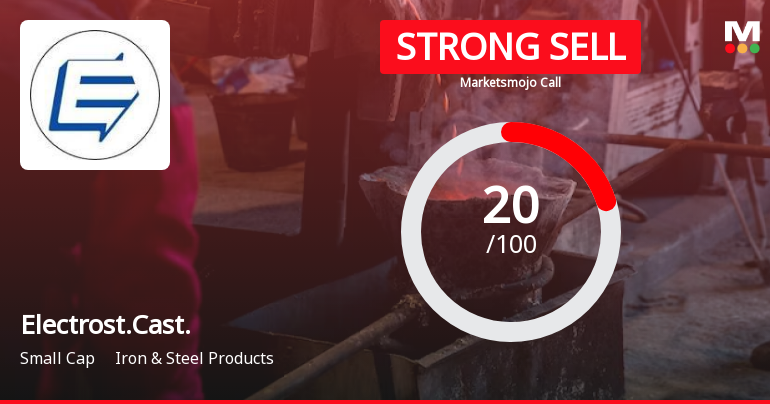
Electrosteel Castings Ltd is Rated Strong Sell
Electrosteel Castings Ltd is rated Strong Sell by MarketsMOJO, with this rating last updated on 19 May 2026. However, the analysis and financial metrics discussed here reflect the stock’s current position as of 31 May 2026, providing investors with the most up-to-date insight into the company’s performance and outlook.
Read full news article Announcements
Compliances-Reg.24(A)-Annual Secretarial Compliance
30-May-2026 | Source : BSEAnnual Secretarial Compliance Report for the FY ended 31 March 2026
Announcement under Regulation 30 (LODR)-Earnings Call Transcript
21-May-2026 | Source : BSETranscript of Earnings Call held on 18 May 2026
Announcement under Regulation 30 (LODR)-Newspaper Publication
19-May-2026 | Source : BSENewspaper Publication in respect to the Financial Results for the quarter and year ended 31 March 2026.
Corporate Actions

No Upcoming Board Meetings

Electrosteel Castings Ltd has declared 140% dividend, ex-date: 14 Aug 25

Electrosteel Castings Ltd has announced 1:10 stock split, ex-date: 17 Sep 07

No Bonus history available

No Rights history available
Quality key factors
Valuation key factors
Technicals key factors
 Technical Indicator Scale: Bearish, Mildly Bearish, Sideways, Mildly Bullish, Bullish Turned
 Shareholding Snapshot : Mar 2026
Shareholding Compare (%holding)
Promoters
10.543
Held by 5 Schemes (0.16%)
Held by 102 FIIs (15.73%)
G. K. & Sons Private Ltd (8.19%)
Belgrave Investment Fund (5.83%)
25.14%
Quarterly Results Snapshot (Consolidated) - Mar'26 - QoQ

QoQ Growth in quarter ended Mar 2026 is 1.42% vs 5.45% in Dec 2025

QoQ Growth in quarter ended Mar 2026 is 173.03% vs -127.95% in Dec 2025
Half Yearly Results Snapshot (Consolidated) - Sep'25
Growth in half year ended Sep 2025 is -23.08% vs 6.53% in Sep 2024
Growth in half year ended Sep 2025 is -56.09% vs 52.78% in Sep 2024
Nine Monthly Results Snapshot (Consolidated) - Dec'25
YoY Growth in nine months ended Dec 2025 is -21.25% vs 2.66% in Dec 2024
YoY Growth in nine months ended Dec 2025 is -73.13% vs 5.55% in Dec 2024
Annual Results Snapshot (Consolidated) - Mar'26
YoY Growth in year ended Mar 2026 is -19.15% vs -2.11% in Mar 2025
YoY Growth in year ended Mar 2026 is -77.25% vs -4.10% in Mar 2025
About Electrosteel Castings Ltd

Company Coordinates


