
Compare Fairchem Organic with Similar Stocks
Stock DNA
Specialty Chemicals
INR 747 Cr (Micro Cap)
117.00
42
1.30%
0.18
2.18%
2.56
Total Returns (Price + Dividend) 
Latest dividend: 7.5 per share ex-dividend date: Aug-04-2025
Risk Adjusted Returns v/s
Returns Beta

News

Fairchem Organics Ltd is Rated Sell
Fairchem Organics Ltd is rated 'Sell' by MarketsMOJO. This rating was last updated on 16 Apr 2026, reflecting a shift from a previous 'Strong Sell' stance. However, the analysis and financial metrics discussed here represent the stock's current position as of 11 June 2026, providing investors with an up-to-date view of the company’s performance and outlook.
Read full news article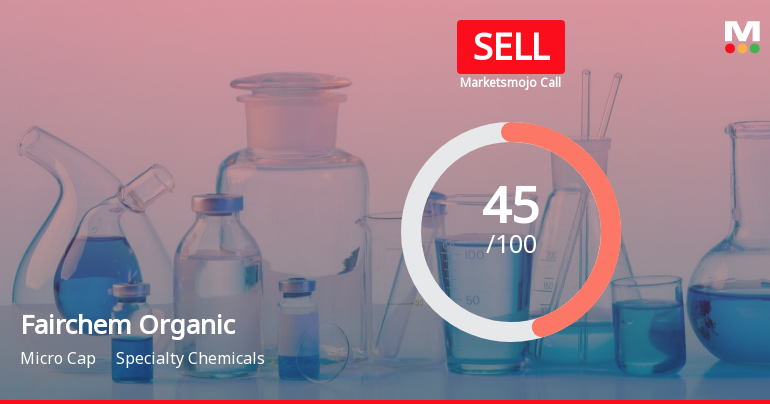
Fairchem Organics Ltd is Rated Sell
Fairchem Organics Ltd is rated 'Sell' by MarketsMOJO, with this rating last updated on 16 Apr 2026. However, the analysis and financial metrics discussed here reflect the stock's current position as of 31 May 2026, providing investors with an up-to-date view of the company’s fundamentals, returns, and market performance.
Read full news article
Fairchem Organics Ltd is Rated Sell
Fairchem Organics Ltd is rated 'Sell' by MarketsMOJO, with this rating last updated on 16 Apr 2026. However, the analysis and financial metrics presented here reflect the stock's current position as of 20 May 2026, providing investors with an up-to-date view of the company’s fundamentals, returns, and market standing.
Read full news article Announcements
Announcement under Regulation 30 (LODR)-Newspaper Publication
10-Jun-2026 | Source : BSEWe attach herewith the copies of the newspaper publication for forthcoming Annual General Meeting of the Company TDS on Dividend payment for FY 2025-26 and updation of particulars of the shareholders.
Compliances-Reg.24(A)-Annual Secretarial Compliance
12-May-2026 | Source : BSEPlease find attached herewith the Secretarial Compliance Report for F.Y. 2025-26
Announcement under Regulation 30 (LODR)-Earnings Call Transcript
09-May-2026 | Source : BSEPlease find attached herewith transcript of audio recording of Earnings Concall on Audited Financial Results for the Quarter and Year Ended March 31 2026
Corporate Actions

No Upcoming Board Meetings

Fairchem Organics Ltd has declared 10% dividend, ex-date: 20 Jul 26

No Splits history available

No Bonus history available

No Rights history available
Quality key factors
Valuation key factors
Technicals key factors
 Technical Indicator Scale: Bearish, Mildly Bearish, Sideways, Mildly Bullish, Bullish Turned
 Shareholding Snapshot : Mar 2026
Shareholding Compare (%holding)
Promoters
None
Held by 1 Schemes (0.0%)
Held by 8 FIIs (6.35%)
Fih Mauritius Investments Ltd (54.61%)
Massachusetts Institute Of Technology (3.33%)
17.84%
Quarterly Results Snapshot (Standalone) - Mar'26 - QoQ

QoQ Growth in quarter ended Mar 2026 is 16.78% vs -10.21% in Dec 2025
QoQ Growth in quarter ended Mar 2026 is 3,790.00% vs -112.99% in Dec 2025
Half Yearly Results Snapshot (Standalone) - Sep'25

Growth in half year ended Sep 2025 is -20.08% vs -2.78% in Sep 2024
Growth in half year ended Sep 2025 is -89.08% vs 8.84% in Sep 2024
Nine Monthly Results Snapshot (Standalone) - Dec'25
YoY Growth in nine months ended Dec 2025 is -17.84% vs -9.30% in Dec 2024
YoY Growth in nine months ended Dec 2025 is -91.35% vs -25.61% in Dec 2024
Annual Results Snapshot (Standalone) - Mar'26
YoY Growth in year ended Mar 2026 is -14.55% vs -13.45% in Mar 2025
YoY Growth in year ended Mar 2026 is -74.78% vs -45.75% in Mar 2025
About Fairchem Organics Ltd

Company Coordinates


