
Compare Fractal Analyt. with Similar Stocks
Stock DNA
Software Products
INR 16,248 Cr (Mid Cap)
51.00
20
0.00%
-0.51
9.50%
5.03
Total Returns (Price + Dividend) 
Fractal Analyt. for the last several years.
Risk Adjusted Returns v/s
Returns Beta

News
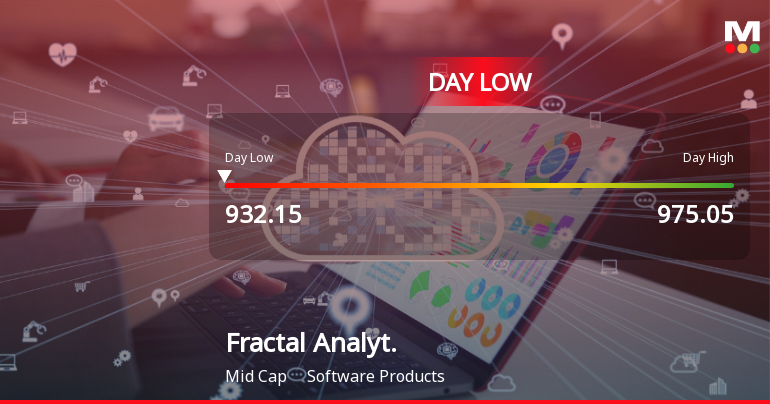
Fractal Analytics Ltd Hits Intraday Low Amid Price Pressure on 10 June 2026
Fractal Analytics Ltd experienced a notable decline today, touching an intraday low of Rs 935.05, reflecting a price drop of 5.15%. The stock underperformed its sector and the broader market, facing immediate selling pressure amid mixed technical signals and cautious market sentiment.
Read full news article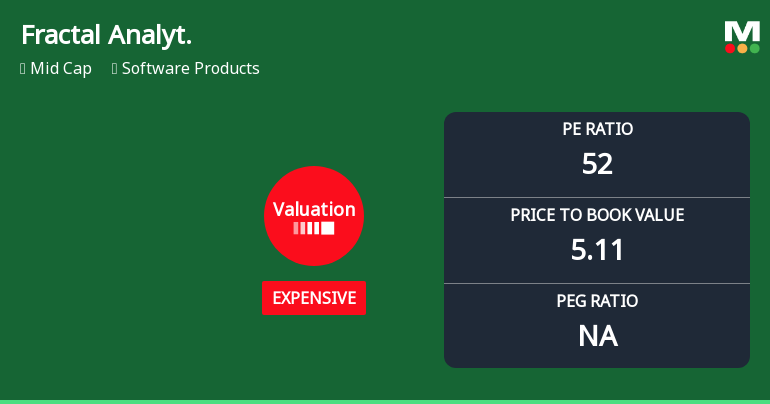
Fractal Analytics Ltd Valuation Shifts Signal Price Attractiveness Change Amid Sector Dynamics
Fractal Analytics Ltd, a mid-cap player in the Software Products sector, has experienced a notable shift in its valuation parameters, moving from a 'very expensive' to an 'expensive' rating. This change reflects evolving market perceptions amid a recent 5.66% drop in share price, prompting investors to reassess the stock’s price attractiveness relative to its historical and peer benchmarks.
Read full news article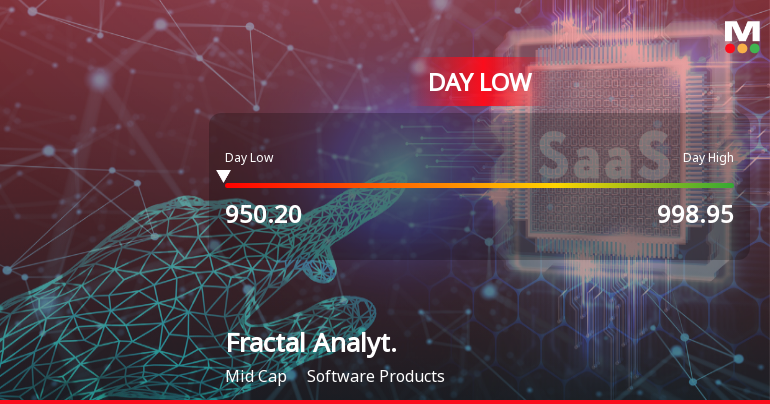
Fractal Analytics Ltd Hits Intraday Low Amid Price Pressure on 8 June 2026
Fractal Analytics Ltd experienced a notable intraday decline on 8 June 2026, touching a low of Rs 953.8, reflecting a 4.98% drop from previous levels. The stock underperformed its sector and broader market indices, pressured by prevailing market sentiment and technical factors.
Read full news article Announcements
Announcement under Regulation 30 (LODR)-Analyst / Investor Meet - Intimation
05-Jun-2026 | Source : BSESchedule of Analysts or Institutional Investors meet
Announcement under Regulation 30 (LODR)-Change in Management
03-Jun-2026 | Source : BSEChange in Senior Management of the Company
Announcement under Regulation 30 (LODR)-Analyst / Investor Meet - Intimation
01-Jun-2026 | Source : BSESchedule of Analysts or Institutional Investors meet
Corporate Actions

No Upcoming Board Meetings

No Dividend history available

No Splits history available

No Bonus history available

No Rights history available
Quality key factors
Valuation key factors
Technicals key factors
 Technical Indicator Scale: Bearish, Mildly Bearish, Sideways, Mildly Bullish, Bullish Turned
 Shareholding Snapshot : Mar 2026
Shareholding Compare (%holding)
FIIs
3.4242
Held by 12 Schemes (7.95%)
Held by 38 FIIs (40.48%)
Pranay Agrawal (4.72%)
Tpg Fett Holdings Pte. Ltd. (22.27%)
11.12%
Quarterly Results Snapshot (Standalone) - Mar'26 - QoQ

QoQ Growth in quarter ended Mar 2026 is 4.87% vs 10.39% in Dec 2025
QoQ Growth in quarter ended Mar 2026 is 48.88% vs 111.59% in Dec 2025
Half Yearly Results Snapshot (Consolidated) - Sep'25
Not Applicable: The company has declared_date for only one period
Not Applicable: The company has declared_date for only one period
Nine Monthly Results Snapshot (Consolidated) - Dec'25
Not Applicable: The company has declared_date for only one period
Not Applicable: The company has declared_date for only one period
Annual Results Snapshot (Consolidated) - Mar'26
YoY Growth in year ended Mar 2026 is 19.32% vs 25.91% in Mar 2025
YoY Growth in year ended Mar 2026 is 31.03% vs 569.47% in Mar 2025
About Fractal Analytics Ltd

Company Coordinates


