
Compare Gem Aromatics with Similar Stocks
Dashboard
Weak Long Term Fundamental Strength with a 12.51% CAGR growth in Operating Profits over the last 5 years
- The company has been able to generate a Return on Equity (avg) of 18.80% signifying low profitability per unit of shareholders funds
The company has declared Negative results for the last 3 consecutive quarters
Stock DNA
Specialty Chemicals
INR 847 Cr (Micro Cap)
603.00
42
0.00%
0.18
5.80%
1.88
Total Returns (Price + Dividend) 
Gem Aromatics for the last several years.
Risk Adjusted Returns v/s
Returns Beta

News
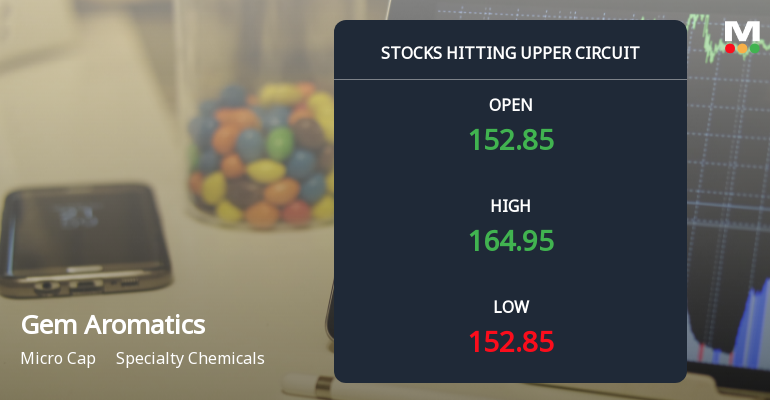
Gem Aromatics Ltd Locks at Upper Circuit With 5% Gain Amid Rising Delivery Volumes
At Rs 163.30, Gem Aromatics Ltd reached its upper circuit limit of 5% on 8 Jun 2026, with buyers lined up and no sellers willing to part with shares. The exchange ceiling halted the rally, not the demand, signalling unfilled buying interest in this micro-cap specialty chemicals stock.
Read full news article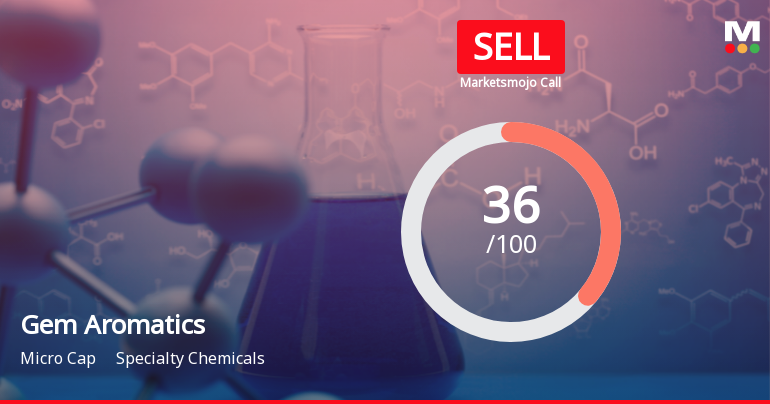
Gem Aromatics Ltd Upgraded to Sell on Technical and Valuation Improvements
Gem Aromatics Ltd, a micro-cap player in the specialty chemicals sector, has seen its investment rating upgraded from Strong Sell to Sell as of 5 June 2026. This change reflects a nuanced improvement across technical indicators and valuation metrics, despite ongoing challenges in financial performance. The company’s stock price has responded positively, rising nearly 5% on the day of the announcement, signalling cautious optimism among investors.
Read full news article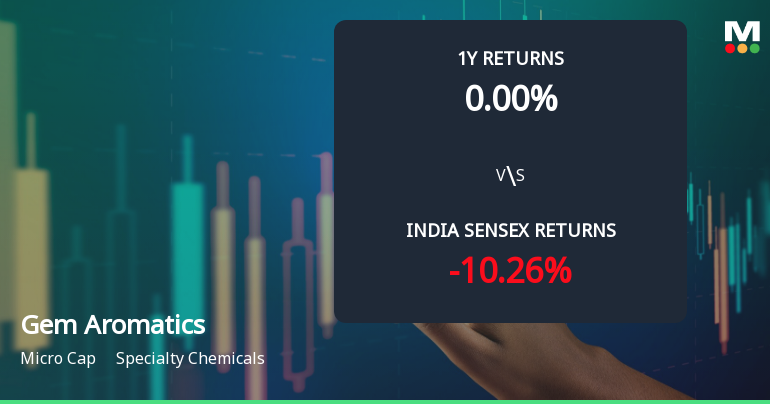
Gem Aromatics Ltd Sees Mildly Bullish Momentum Amid Technical Shift
Gem Aromatics Ltd, a micro-cap player in the specialty chemicals sector, has exhibited a notable shift in price momentum and technical indicators, signalling a transition from a sideways trend to a mildly bullish stance. Despite a challenging year-to-date performance, recent technical signals suggest cautious optimism for investors monitoring this stock.
Read full news article Announcements
Disclosure Received Under Regulation 29(2) Of SEBI (Substantial Acquisition Of Shares And Takeovers) Regulations 2011.
04-Jun-2026 | Source : BSEDisclosure received under Regulation 29(2) of SEBI (SAST) Regulations 2011.
Announcement under Regulation 30 (LODR)-Code of Conduct under SEBI (PIT) Regulations 2015
04-Jun-2026 | Source : BSEDisclosure as per Regulation 7(2) of SEBI (PIT) Regulations 2015.
Disclosure Received Under Regulation 29(2) Of SEBI (Substantial Acquisition Of Shares And Takeovers) Regulations 2011.
04-Jun-2026 | Source : BSEDisclosure received under Regulation 29(2) of SEBI (SAST) Regulations 2011.
Corporate Actions

No Upcoming Board Meetings

No Dividend history available

No Splits history available

No Bonus history available

No Rights history available
Quality key factors
Valuation key factors
Technicals key factors
 Technical Indicator Scale: Bearish, Mildly Bearish, Sideways, Mildly Bullish, Bullish Turned
 Shareholding Snapshot : Mar 2026
Shareholding Compare (%holding)
Promoters
None
Held by 0 Schemes
Held by 8 FIIs (1.06%)
Parekh Family Trust (20.29%)
Doterra Enterprises S.a.r.l. (18.36%)
14.69%
Quarterly Results Snapshot (Standalone) - Mar'26 - QoQ

QoQ Growth in quarter ended Mar 2026 is 33.78% vs -14.74% in Dec 2025
QoQ Growth in quarter ended Mar 2026 is 181.95% vs 2.43% in Dec 2025
Half Yearly Results Snapshot (Standalone) - Sep'25
Not Applicable: The company has declared_date for only one period
Not Applicable: The company has declared_date for only one period
Nine Monthly Results Snapshot (Standalone) - Dec'25
Not Applicable: The company has declared_date for only one period
Not Applicable: The company has declared_date for only one period
Annual Results Snapshot (Consolidated) - Mar'26

YoY Growth in year ended Mar 2026 is -27.28% vs 11.38% in Mar 2025
YoY Growth in year ended Mar 2026 is -97.32% vs 6.55% in Mar 2025
About Gem Aromatics Ltd

Company Coordinates


