
Compare Greenply Industr with Similar Stocks
Stock DNA
Plywood Boards/ Laminates
INR 3,692 Cr (Small Cap)
38.00
53
0.17%
0.54
11.09%
4.18
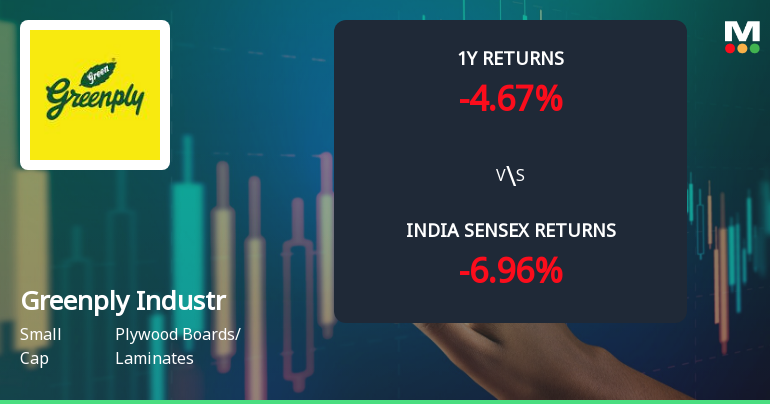
Total Returns (Price + Dividend) 
Latest dividend: 0.5004752851711026 per share ex-dividend date: Aug-04-2025
Risk Adjusted Returns v/s
Returns Beta

News
Greenply Industries Ltd Sees Shift to Mildly Bullish Momentum Amid Mixed Technical Signals
Greenply Industries Ltd, a key player in the plywood boards and laminates sector, has experienced a notable shift in its technical momentum, moving from a mildly bearish stance to a mildly bullish one. This change is underscored by a complex interplay of technical indicators, including MACD, RSI, moving averages, and Bollinger Bands, signalling a nuanced outlook for investors amid mixed monthly and weekly trends.
Read full news article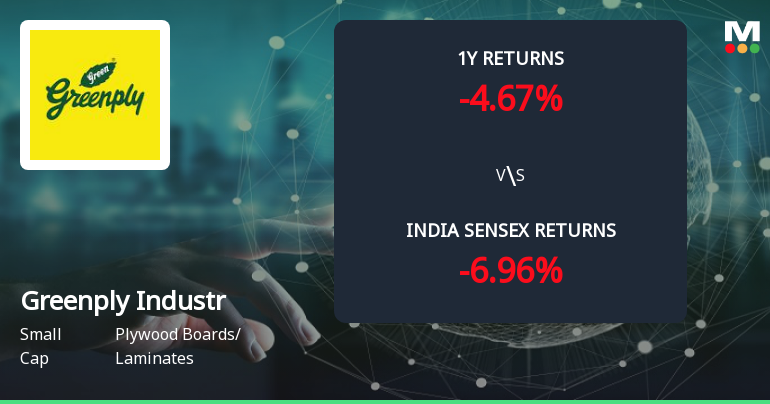
Greenply Industries Ltd Forms Golden Cross Amid Mixed Technical Signals
The 50-day moving average for Greenply Industries Ltd has crossed above the 200-day moving average, creating a golden cross on 23 Jun 2026. While this technical event often signals a shift towards bullish momentum, the broader technical and fundamental context for this small-cap plywood and laminates company presents a more nuanced picture.
Read full news article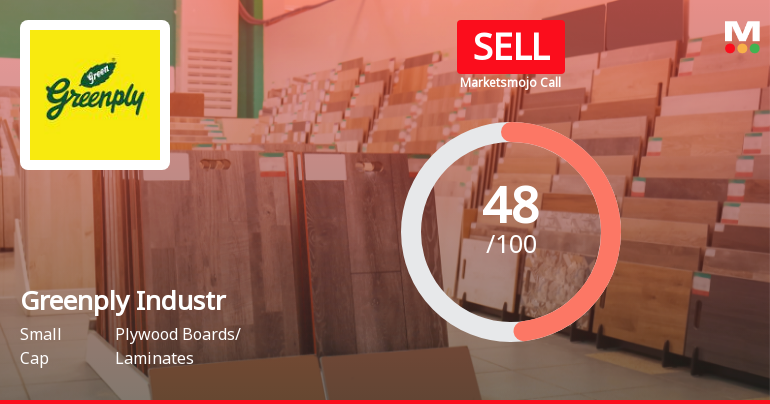
Greenply Industries Ltd Downgraded to Sell Amid Mixed Financial and Technical Signals
Greenply Industries Ltd, a key player in the plywood boards and laminates sector, has seen its investment rating downgraded from Hold to Sell by MarketsMOJO as of 22 June 2026. This shift reflects a complex interplay of factors including deteriorating technical trends, modest financial growth, valuation concerns, and quality assessments, signalling caution for investors despite some recent positive quarterly results.
Read full news article Announcements
Intimation For Cancellation Of Scheduled Plant Visit By Investors And Analysts
17-Jun-2026 | Source : BSEIntimation of Cancellation of Scheduled Plant visit by Investors and Analysts which was scheduled on 24.06.2026.
Announcement under Regulation 30 (LODR)-Acquisition
05-Jun-2026 | Source : BSEPlease be informed that the Companys Wholly Owned Subsidiary (WOS) Greenply Sandila Private Limited has made investment in equity shares of Albano Solar Private Limited
Announcement under Regulation 30 (LODR)-Newspaper Publication
04-Jun-2026 | Source : BSENewspaper Publication - Public Notice to the Shareholders regarding opening of special window for Transfer and Dematerialisation of Physical Shares of Greenply Industries Limited
Corporate Actions

No Upcoming Board Meetings

Greenply Industries Ltd has declared 50% dividend, ex-date: 04 Aug 25

Greenply Industries Ltd has announced 1:5 stock split, ex-date: 06 Jan 16

No Bonus history available

Greenply Industries Ltd has announced 3:10 rights issue, ex-date: 07 Sep 09
Quality key factors
Valuation key factors
Technicals key factors
 Technical Indicator Scale: Bearish, Mildly Bearish, Sideways, Mildly Bullish, Bullish Turned
 Shareholding Snapshot : Mar 2026
Shareholding Compare (%holding)
Promoters
None
Held by 10 Schemes (30.55%)
Held by 44 FIIs (4.19%)
Shakuntala Safeinvest Private Limited (formerly Known As Showan Investment Private Limited) (37.37%)
Mirae Asset Elss Tax Saver Fund (9.93%)
8.72%
Quarterly Results Snapshot (Consolidated) - Mar'26 - YoY

YoY Growth in quarter ended Mar 2026 is 19.65% vs 8.17% in Mar 2025
YoY Growth in quarter ended Mar 2026 is 86.47% vs -41.91% in Mar 2025
Half Yearly Results Snapshot (Consolidated) - Sep'25

Growth in half year ended Sep 2025 is 5.31% vs 22.68% in Sep 2024
Growth in half year ended Sep 2025 is -12.29% vs 244.36% in Sep 2024
Nine Monthly Results Snapshot (Consolidated) - Dec'25
YoY Growth in nine months ended Dec 2025 is 6.74% vs 16.37% in Dec 2024
YoY Growth in nine months ended Dec 2025 is -21.72% vs 80.69% in Dec 2024
Annual Results Snapshot (Consolidated) - Mar'26
YoY Growth in year ended Mar 2026 is 10.11% vs 14.11% in Mar 2025
YoY Growth in year ended Mar 2026 is -2.29% vs 30.97% in Mar 2025
About Greenply Industries Ltd

Company Coordinates


