
Compare Happiest Minds with Similar Stocks
Dashboard
Poor long term growth as Operating profit has grown by an annual rate 13.64% of over the last 5 years
With ROE of 13.4, it has a Expensive valuation with a 3.1 Price to Book Value
Falling Participation by Institutional Investors
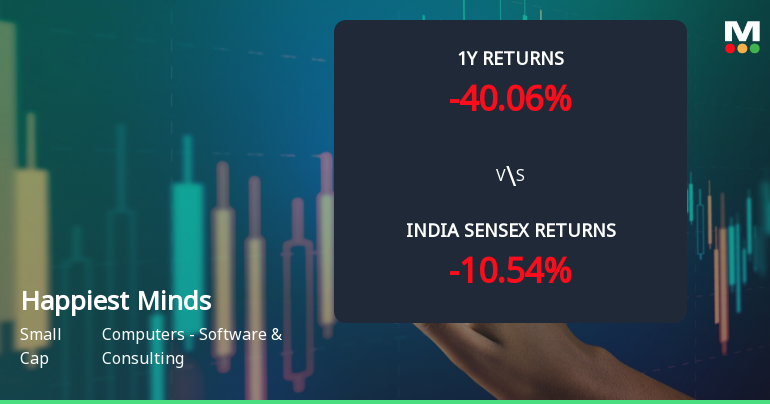
Consistent Underperformance against the benchmark over the last 3 years
Stock DNA
Computers - Software & Consulting
INR 5,257 Cr (Small Cap)
23.00
20
1.79%
0.04
13.40%
3.14
Total Returns (Price + Dividend) 
Latest dividend: 2.74 per share ex-dividend date: Nov-04-2025
Risk Adjusted Returns v/s
Returns Beta

News
Happiest Minds Technologies Ltd Faces Bearish Momentum Amid Technical Downgrade
Happiest Minds Technologies Ltd has experienced a notable shift in its technical momentum, with key indicators signalling a bearish trend. The company’s stock price has declined sharply in recent sessions, reflecting deteriorating market sentiment and a downgrade in its technical rating from Hold to Sell as of 8 June 2026.
Read full news article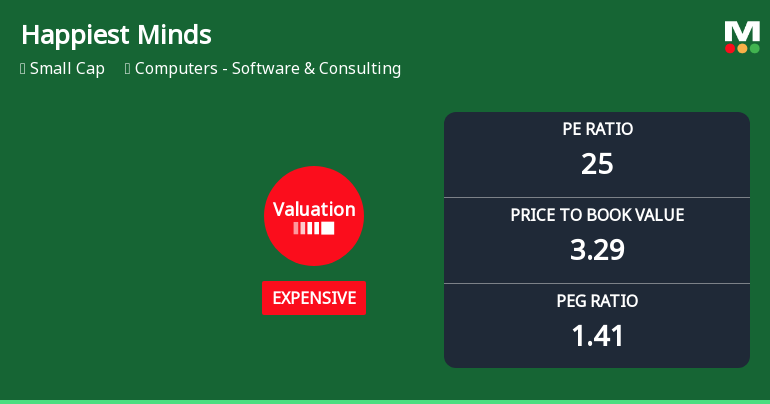
Happiest Minds Technologies Ltd: Valuation Shift Signals Price Attractiveness Change
Happiest Minds Technologies Ltd has seen its valuation parameters shift notably, moving from fair to expensive territory as reflected in its current price-to-earnings (P/E) and price-to-book value (P/BV) ratios. Despite a challenging market backdrop and underperformance relative to the Sensex, the company’s financial metrics and peer comparisons reveal a nuanced picture for investors assessing its price attractiveness.
Read full news article
Happiest Minds Technologies Ltd is Rated Hold
Happiest Minds Technologies Ltd is rated 'Hold' by MarketsMOJO, with this rating last updated on 06 April 2026. However, all fundamentals, returns, and financial metrics discussed here reflect the stock's current position as of 01 June 2026, providing investors with the latest comprehensive analysis.
Read full news article Announcements
Announcement under Regulation 30 (LODR)-Analyst / Investor Meet - Intimation
08-Jun-2026 | Source : BSEIntimation of Schedule of Analyst/ Institutional Investor Meeting under SEBI (LODR) Regulations 2015
Receipt Of CTC Of Final Order By Honble NCLT Bengaluru Bench
05-Jun-2026 | Source : BSEReceipt of Certified True Copy of Final Order by the Honble National Company Law Tribunal Bengaluru Bench in the matter of the Composite Scheme of Arrangement of PureSoftware Technologies Private Limited and Happiest Minds Technologies Limited and their respective Shareholders and Creditors
Communication To Shareholders - Financial Results For The Quarter And Financial Year Ended March 31 2026
02-Jun-2026 | Source : BSECommunication to Shareholders - Financial Results for the quarter and financial year ended March 31 2026
Corporate Actions

No Upcoming Board Meetings

Happiest Minds Technologies Ltd has declared 182% dividend, ex-date: 17 Jul 26

No Splits history available

No Bonus history available

No Rights history available
Quality key factors
Valuation key factors
Technicals key factors
 Technical Indicator Scale: Bearish, Mildly Bearish, Sideways, Mildly Bullish, Bullish Turned
 Shareholding Snapshot : Mar 2026
Shareholding Compare (%holding)
Promoters
1.7585
Held by 9 Schemes (7.0%)
Held by 89 FIIs (5.94%)
Ashok Soota (32.34%)
Sbi Small Cap Fund (7.19%)
34.61%
Quarterly Results Snapshot (Consolidated) - Mar'26 - QoQ

QoQ Growth in quarter ended Mar 2026 is 2.81% vs 2.44% in Dec 2025
QoQ Growth in quarter ended Mar 2026 is 51.79% vs -25.40% in Dec 2025
Half Yearly Results Snapshot (Consolidated) - Sep'25

Growth in half year ended Sep 2025 is 14.00% vs 23.57% in Sep 2024
Growth in half year ended Sep 2025 is 10.54% vs -13.91% in Sep 2024
Nine Monthly Results Snapshot (Consolidated) - Dec'25
YoY Growth in nine months ended Dec 2025 is 12.84% vs 25.58% in Dec 2024
YoY Growth in nine months ended Dec 2025 is 0.53% vs -14.60% in Dec 2024
Annual Results Snapshot (Consolidated) - Mar'26
YoY Growth in year ended Mar 2026 is 12.34% vs 26.85% in Mar 2025
YoY Growth in year ended Mar 2026 is 15.14% vs -25.66% in Mar 2025
About Happiest Minds Technologies Ltd

Company Coordinates


