I T D C

  • Market Cap: Small Cap
  • Industry: Hotels & Resorts
  • ISIN: INE353K01014
  • NSEID: ITDC
  • BSEID: 532189
INR
647.45
-14.7 (-2.22%)
BSENSE

Aug 31, 01:22 PM

BSE+NSE Vol: 60.06 k

  • Price Points
  • Score
  • Mojo Parameters
  • Total Return
  • News and Corporate Actions
  • Key factors
  • Shareholding
  • Financials
  • CompanyCV
stock-summaryPrice Point
High/Low

1Day

52 Week

Valuation
Technical
Day's Volume

CASH

60.06 k (33.85%) Volume

Shareholding (Jun 2026)

FII

0.03%

Held by 4 FIIs

DII

1.78%

Held by 1 DIIs

Promoter

87.03%

Why is India Tourism Development Corporation Ltd falling/rising?

31-Aug-2026

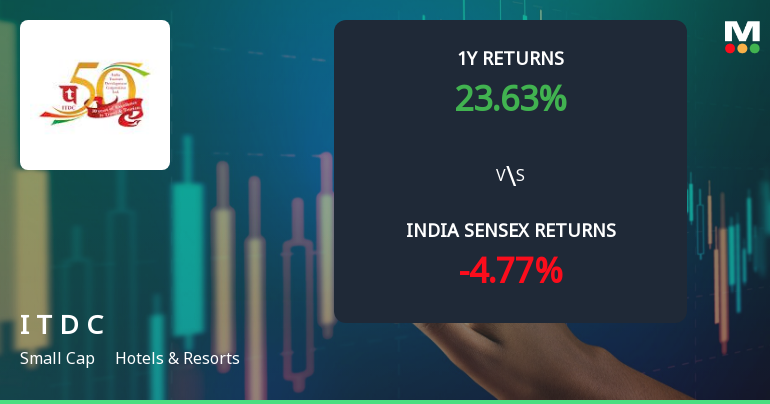
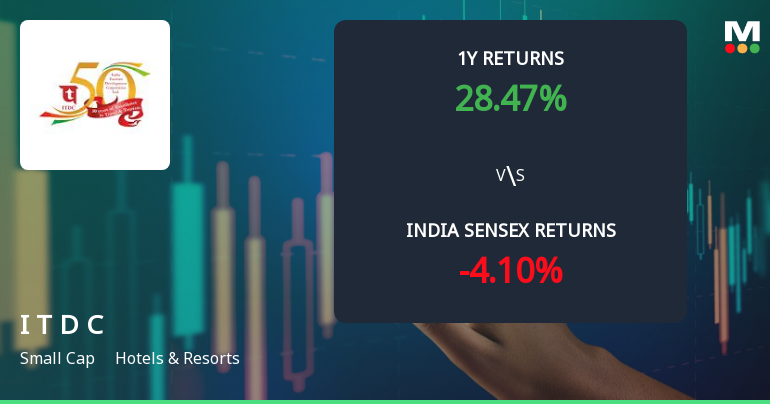
As of 30-Aug, the stock price of India Tourism Development Corporation Ltd is rising to 662.75, reflecting strong long-term performance with a year-to-date return of 13.26% and a 25.18% increase over the past year, significantly outperforming the Sensex. Positive investor sentiment and the company's net-debt-free status further support the stock's upward momentum.

As of 30-Aug, the stock price of India Tourism Development Corporation Ltd is rising, currently at 662.75, with a change of 2.95 (0.45%) upwards. This increase can be attributed to several factors highlighted in the provided data. <BR><BR>Firstly, the stock has shown a strong performance in the long term, with a year-to-date return of 13.26% compared to a decline of 9.34% in the benchmark Sensex. Over the past year, the stock has appreciated by 25.18%, significantly outperforming the Sensex, which fell by 3.52%. Additionally, over the last three years, the stock has surged by 70.99%, while the Sensex only increased by 18.87%. <BR><BR>Today's performance also indicates positive momentum, as the stock outperformed its sector by 1.91%. It reached an intraday high of Rs 674.8, reflecting a 2.27% increase during the trading session. The rising investor participation is another positive sign, with delivery volume on 27 August increasing by 94.99% compared to the five-day average. <BR><BR>Moreover, the company is net-debt free and has demonstrated healthy long-term growth, with operating profit growing at an annual rate of 33.28%. This combination of strong historical performance, positive investor sentiment, and solid financial health contributes to the stock's rising price.

View full answer

Who are in the management team of I T D C?

14-Aug-2026

The management team of I T D C includes key members such as Kamalavardhana Rao Ganji and Mebanshailang Rynjah Synrem (Managing Directors), Piyush Tiwari (Director of Commercial & Marketing), and V K Jain (Company Secretary). The team oversees the company's operations and governance.

The management team of I T D C includes the following key members:<BR><BR>1. **Piyush Tiwari** - Director (Commercial & Marketing)<BR>2. **V K Jain** - Company Secretary & Compliance Officer<BR>3. **Chetan Prakash Jain** - Nominee (Government)<BR>4. **Sambit Patra** - Chairman (Non-Executive)<BR>5. **Anju Bajpai** - Non-Official Director<BR>6. **Manan Kaushal** - Non-Official Director<BR>7. **Lokesh Kumar Aggarwal** - Director (Finance)<BR>8. **Kamalavardhana Rao Ganji** - Managing Director<BR>9. **Mebanshailang Rynjah Synrem** - Managing Director<BR><BR>This team oversees various aspects of the company's operations and governance. If you have any more questions about I T D C or its management, feel free to ask!

View full answer

What does I T D C do?

14-Aug-2026

India Tourism Development Corporation Ltd (ITDC) operates in the Hotels & Resorts industry, providing hotel, restaurant, and transport services for tourists. As of June 2026, it reported net sales of 90 Cr and a net profit of 10 Cr, with a market cap of INR 6,081 Cr.

Overview: <BR>India Tourism Development Corporation Ltd (ITDC) operates in the Hotels & Resorts industry as a small-cap company, providing hotel and restaurant services for tourists along with transport facilities.<BR><BR>History: <BR>ITDC was incorporated in March 1965. The latest quarterly results reported net sales and net profit for June 2026.<BR><BR>Financial Snapshot: <BR>Net Sales: 90 Cr (Quarterly Results - Jun 2026) <BR>Net Profit: 10 Cr (Quarterly Results - Jun 2026) <BR>Market Cap: INR 6,081 Cr (Small Cap)<BR><BR>Key Metrics: <BR>P/E: 73.00 <BR>Industry P/E: 36 <BR>Dividend Yield: 0.40% <BR>Debt-Equity: -0.64 <BR>Return on Equity: 19.64% <BR>Price to Book: 14.62<BR><BR>Contact Details: <BR>Address: SCOPE Complex, Core 8 6th Floor 7 Lodi Road New Delhi New Delhi : 110003 <BR>Tel: 91-11-24360249 <BR>Email: vkjain@theashokgroup.com <BR>Website: http://www.theashokgroup.com

View full answer

Who are the peers of the I T D C?

14-Aug-2026

I T D C's peers include EIH, Chalet Hotels, Leela Palaces Ho, Ventive Hospital, Lemon Tree Hotel, Mahindra Holiday, Juniper Hotels, Samhi Hotels, and Apeejay Surrend. In terms of management risk, growth, and capital structure, I T D C is rated as good, with a 1-year return of 29.27%, while Leela Palaces Ho leads with a 16.25% return.

Peers: The peers of I T D C are EIH, Chalet Hotels, Leela Palaces Ho, Ventive Hospital, Lemon Tree Hotel, Mahindra Holiday, Juniper Hotels, Samhi Hotels, and Apeejay Surrend.<BR><BR>Quality Snapshot: Excellent management risk is observed at EIH and Lemon Tree Hotel, while Good management risk is found at I T D C. Average management risk is noted for Mahindra Holiday, Juniper Hotels, and Apeejay Surrend, and the rest have Below Average management risk, including Chalet Hotels, Leela Palaces Ho, Ventive Hospital, and Samhi Hotels. For Growth, Excellent growth is seen at EIH, Chalet Hotels, Ventive Hospital, and Lemon Tree Hotel, while Good growth is noted for I T D C and Mahindra Holiday. Average growth is found at Leela Palaces Ho, and Below Average growth is observed at Juniper Hotels and Apeejay Surrend, with the rest having Good growth. In terms of Capital Structure, Excellent capital structure is held by I T D C and EIH, while Good capital structure is noted for Apeejay Surrend, Average for Leela Palaces Ho and Ventive Hospital, and Below Average for Chalet Hotels, Lemon Tree Hotel, Mahindra Holiday, Juniper Hotels, and Samhi Hotels.<BR><BR>Return Snapshot: The peer with the highest 1-year return is Leela Palaces Ho at 16.25%, while Mahindra Holiday has the lowest at -37.49%. I T D C's 1-year return is 29.27%, which is significantly higher than Mahindra Holiday but lower than Leela Palaces Ho. Additionally, several peers, including Mahindra Holiday, Juniper Hotels, and Samhi Hotels, have negative six-month returns.

View full answer

How big is I T D C?

14-Aug-2026

As of 14th August, India Tourism Development Corporation Ltd has a market capitalization of 6,030.00 Cr, with recent net sales of 535.38 Cr and net profit of 82.34 Cr over the last four quarters.

As of 14th August, <BR><BR>Market Cap: India Tourism Development Corporation Ltd has a market capitalization of 6,030.00 Cr, classifying it as a Small Cap company.<BR><BR>Recent Quarterly Performance: The sum of Net Sales for the latest 4 quarters is 535.38 Cr, while the sum of Net Profit for the same period is 82.34 Cr.<BR><BR>Balance Sheet Snapshot: The reporting period for the latest annual data is March 2025. Shareholder's Funds stand at 363.78 Cr, and Total Assets amount to 700.48 Cr.

View full answer

Should I buy, sell or hold India Tourism Development Corporation Ltd?

12-Aug-2026

When is the next results date for India Tourism Development Corporation Ltd?

04-Aug-2026

The next results date for India Tourism Development Corporation Ltd is 10 August 2026.

The next results date for India Tourism Development Corporation Ltd is scheduled for 10 August 2026.

View full answer

Are India Tourism Development Corporation Ltd latest results good or bad?

22-May-2026

India Tourism Development Corporation Ltd's latest results show a net profit increase of 12.66% to ₹28.29 crore, indicating improved profitability. However, revenue fell 28.97% to ₹142.01 crore, raising concerns about demand sustainability despite strong operational efficiency.

The latest results for India Tourism Development Corporation Ltd (ITDC) present a mixed picture. On one hand, the company reported a net profit of ₹28.29 crore for Q4 FY26, which is a 12.66% increase year-on-year. This indicates that ITDC has managed to improve its profitability despite challenging conditions.<BR><BR>However, the revenue for the same quarter saw a significant decline, dropping 28.97% year-on-year to ₹142.01 crore. This sharp decrease reflects the seasonal nature of the hospitality business, as Q4 typically experiences lower tourist activity following the peak winter season. <BR><BR>Despite the revenue challenges, ITDC demonstrated strong operational efficiency, with operating margins (excluding other income) improving to 21.46%, up from 16.10% in the previous year. This improvement in margins suggests effective cost management strategies are in place.<BR><BR>In summary, while ITDC's profit growth is a positive sign, the substantial drop in revenue raises concerns about demand sustainability and the company's ability to navigate seasonal fluctuations. Overall, the results can be seen as good in terms of profitability but concerning regarding revenue performance.

View full answer

Is I T D C technically bullish or bearish?

04-Dec-2025

As of December 3, 2025, the market trend is mildly bearish, supported by bearish signals from the weekly MACD and Bollinger Bands, despite a mildly bullish daily moving average.

As of 3 December 2025, the technical trend has changed from sideways to mildly bearish. The current stance is mildly bearish, driven primarily by the weekly MACD and Bollinger Bands indicating bearish conditions. The Dow Theory also supports a mildly bearish outlook on both weekly and monthly time frames. While the daily moving averages show a mildly bullish signal, the overall strength remains weak due to negative performance in the monthly indicators and the stock's underperformance compared to the Sensex across multiple time frames.

View full answer

How has been the historical performance of I T D C?

03-Dec-2025

I T D C has demonstrated strong historical performance, with net sales increasing from 176.87 Cr in March 2021 to 570.73 Cr in March 2025, and a net profit of 81.55 Cr for the year ending March 2025. Despite a decrease in total assets and liabilities, the company has shown resilience with improved cash flow and profitability.

Answer:<BR>The historical performance of I T D C shows a significant upward trend in net sales and profit over the years, culminating in a net profit of 81.55 Cr for the year ending March 2025.<BR><BR>Breakdown:<BR>I T D C's net sales have steadily increased from 176.87 Cr in March 2021 to 570.73 Cr in March 2025, reflecting a strong growth trajectory. The total operating income followed a similar pattern, rising from 289.40 Cr in March 2022 to 570.73 Cr in March 2025. Operating profit, excluding other income, peaked at 85.44 Cr in March 2025, although it showed a decline from 93.50 Cr in March 2024. Profit before tax also demonstrated a positive trend, reaching 98.78 Cr in March 2025, while profit after tax rose to 81.36 Cr, up from 64.92 Cr in the previous year. The company's total assets decreased from 982.86 Cr in March 2024 to 700.48 Cr in March 2025, and total liabilities also fell from 982.86 Cr to 700.48 Cr during the same period. Cash flow from operating activities improved significantly, resulting in a net cash inflow of 26.00 Cr in March 2025, compared to a net outflow of 14.00 Cr in March 2023. Overall, I T D C has shown resilience and growth in its financial performance over the years.

View full answer

Is I T D C overvalued or undervalued?

10-Sep-2025

As of September 9, 2025, I T D C is considered very expensive with a PE ratio of 70.02 and high valuation metrics compared to peers, indicating it is overvalued despite a recent strong performance.

As of 9 September 2025, the valuation grade for I T D C has moved from expensive to very expensive, indicating a significant increase in perceived valuation. The company is currently overvalued, with a PE Ratio of 70.02, a Price to Book Value of 15.41, and an EV to EBITDA of 62.19. These ratios suggest that the stock is trading at a premium compared to its earnings and book value.<BR><BR>In comparison to its peers, I T D C's valuation metrics are notably high; for instance, Indian Hotels Co has a PE of 64.86 and EV to EBITDA of 38.17, while ITC Hotels shows a PE of 72.69 and EV to EBITDA of 41.48. This positions I T D C at the upper end of the valuation spectrum within the Hotels & Resorts industry. Additionally, despite a recent strong performance with a 20.26% return over the past week compared to a mere 1.18% for the Sensex, the overall valuation suggests that investors may want to exercise caution.

View full answer

Who are the top shareholders of the I T D C?

17-Jul-2025

The top shareholder of I T D C is The President of India, owning 87.03% of the company, followed by The Indian Hotels Company Limited with 7.87%. Individual investors hold 2.96%, while mutual funds and foreign institutional investors have minimal involvement.

The top shareholders of I T D C are primarily the promoters, with the most significant holding being The President of India, who owns 87.03% of the company. The highest public shareholder is The Indian Hotels Company Limited, which holds 7.87%. Additionally, individual investors collectively hold 2.96% of the shares. There are no pledged promoter holdings, and mutual funds and foreign institutional investors have minimal involvement, with only 1 mutual fund scheme and 2 FIIs holding 0.0%.

View full answer

Has I T D C declared dividend?

06-Jun-2025

India Tourism Development Corporation Ltd has declared a 25% dividend, amounting to ₹2.5 per share, with an ex-date of August 30, 2024. While recent short-term returns have been negative, the company has shown significant growth over the long term, particularly a 237.21% total return over the past five years.

India Tourism Development Corporation Ltd has declared a 25% dividend.<BR><BR>Dividend Details:<BR>- Percentage announced: 25%<BR>- Amount per share: 2.5<BR>- Ex-date: 30 Aug 2024<BR><BR>Dividend Yield: 0.4%<BR><BR>Total Returns by Period:<BR>In the last 6 months, the price return was -6.72%, with a dividend return of 0%, resulting in a total return of -6.72%.<BR><BR>Over the past year, the price return was -4.9%, the dividend return was 0.37%, leading to a total return of -4.53%.<BR><BR>In the 2-year period, the price return was 91.3%, with a dividend return of 1.44%, culminating in a total return of 92.74%.<BR><BR>For the 3-year period, the price return was 88.93%, the dividend return was 1.64%, resulting in a total return of 90.57%.<BR><BR>In the last 4 years, the price return was 59.53%, with a dividend return of 1.18%, leading to a total return of 60.71%.<BR><BR>Over the past 5 years, the price return was 235.0%, the dividend return was 2.21%, resulting in a total return of 237.21%.<BR><BR>Overall, the company has declared a dividend, and while recent short-term returns have been negative, the long-term performance shows significant growth, particularly in the 5-year period.

View full answer
iScoreScore
Click here to find our call on this stock
Strong Sell
Sell
Hold
Buy
Strong Buy

Dashboard

1

The company is Net-Debt Free

 
2

Healthy long term growth as Operating profit has grown by an annual rate 33.28%

 
3

Flat results in Jun 26

4

With ROE of 19.6, it has a Very Expensive valuation with a 13.4 Price to Book Value

5

Despite the size of the company, domestic mutual funds hold only 0% of the company

6

Market Beating performance in long term as well as near term

stock-summaryMojo Parameters

Mojo Parameters

Loading Valuation Snapshot...

Stock DNA

stock-summary
Industry

Hotels & Resorts

stock-summary
Market cap

INR 5,553 Cr (Small Cap)

stock-summary
P/E

69.00

stock-summary
Industry P/E

36

stock-summary
Dividend Yield

0.44%

stock-summary
Debt Equity

-0.64

stock-summary
Return on Equity

19.64%

stock-summary
Price to Book

13.45

Revenue and Profits:
Net Sales:
90 Cr
(Quarterly Results - Jun 2026)
Net Profit:
10 Cr
stock-summaryTotal Returns
Total Returns (Price + Dividend) stock-summary
Dividend Yield (0.44%)
TimePeriod
Price Return
Dividend Return
Total Return
3 Months
19.15%
0%
19.15%
6 Months
30.48%
0%
30.48%
1 Year
23.45%
0.53%
23.98%
2 Years
-11.37%
0.41%
-10.96%
3 Years
67.43%
1.96%
69.39%
4 Years
65.17%
2.02%
67.19%
5 Years
72.08%
1.78%
73.86%

Latest dividend: 2.9 per share ex-dividend date: Sep-09-2025

Risk Adjusted Returns v/s stock-summary
Returns Beta
Icon
Beta has not been calculated since enough price history is not available
stock-summaryNews & Corporate Actions

News

Announcements stock-summary

India Tourism Development Corporation Limited - Other General Purpose

21-Nov-2019 | Source : NSE

India Tourism Development Corporation Limited has informed the Exchange regarding Disclosure of related party transactions for the half year ended on September 30, 2019.

India Tourism Development Corporation Limited - Clarification

18-Nov-2019 | Source : NSE

India Tourism Development Corporation Limited Limited with respect to announcement dated 11-Nov-2019, regarding Change in Director(s) of the company. On basis of above the Company is required to clarify following: 1. Brief profile (in case of appointment). The response of the Company is awaited.

India Tourism Development Corporation Limited - Diversification/Disinvestment

16-Oct-2019 | Source : NSE

India Tourism Development Corporation Limited has informed the Exchange about Diversification/Disinvestment

Corporate Actions stock-summary

stock-summary
BOARD MEETING

No Upcoming Board Meetings

stock-summary
DIVIDEND

India Tourism Development Corporation Ltd has declared 29% dividend, ex-date: 09 Sep 25

stock-summary
SPLITS

No Splits history available

stock-summary
BONUS

No Bonus history available

stock-summary
RIGHTS

No Rights history available

stock-summaryKey Factors

Quality key factors stock-summary

Factor
Value
Sales Growth (5y)
22.68%
EBIT Growth (5y)
33.28%
EBIT to Interest (avg)
44.16
Debt to EBITDA (avg)
Negative Net Debt
Net Debt to Equity (avg)
-0.64
Sales to Capital Employed (avg)
1.33
Tax Ratio
27.45%
Dividend Payout Ratio
30.50%
Pledged Shares
0
Institutional Holding
1.81%
ROCE (avg)
-37.48%
ROE (avg)
16.10%

Valuation key factors

Factor
Value
P/E Ratio
69
Industry P/E
36
Price to Book Value
13.45
EV to EBIT
64.61
EV to EBITDA
59.67
EV to Capital Employed
35.47
EV to Sales
10.11
PEG Ratio
21.01
Dividend Yield
0.44%
ROCE (Latest)
55.25%
ROE (Latest)
19.64%

Technicals key factors

Indicator
Weekly
Monthly
MACD
Bullish
Bullish
RSI
Bearish
No Signal
Bollinger Bands
Mildly Bullish
Mildly Bullish
Moving Averages
Mildly Bullish (Daily)
KST
Bullish
Mildly Bullish
Dow Theory
Mildly Bearish
No Trend
OBV
Bullish
Bullish
stock-summary Technical Indicator Scale: Bearish, Mildly Bearish, Sideways, Mildly Bullish, Bullish  Turned 
stock-summaryShareholding
Shareholding Snapshot : Jun 2026stock-summary
Shareholding Compare (%holding) stock-summary
Majority shareholders

Promoters

Pledged Promoter Holdings

None

Mutual Funds

Held by 1 Schemes (0.0%)

FIIs

Held by 4 FIIs (0.03%)

Promoter with highest holding

The President Of India (87.03%)

Highest Public shareholder

The Indian Hotels Company Limited (7.87%)

Individual Investors Holdings

2.9%

stock-summaryFinancial
[
  {
    "link": "quarterly",
    "btn_text": "All Quarterly Results",
    "header": "Quarterly Results Snapshot (Consolidated) - Jun'26 - YoY",
    "rhs": [
      {
        "prefix": "Net Sales ",
        "suffix": "YoY Growth in quarter ended Jun 2026 is 2.68% vs 3.34% in Jun 2025",
        "dir": -1
      },
      {
        "prefix": "Consolidated Net Profit ",
        "suffix": "YoY Growth in quarter ended Jun 2026 is -3.64% vs -16.41% in Jun 2025",
        "dir": 1
      }
    ],
    "table": {
      "header": [
        "Jun'26",
        "Jun'25",
        "Change(%)"
      ],
      "body": [
        {
          "field": "Net Sales",
          "val1": "90.10",
          "val2": "87.75",
          "chgp": "2.68%",
          "chgp_class": "positive"
        },
        {
          "field": "Operating Profit (PBDIT) excl Other Income",
          "val1": "8.33",
          "val2": "8.98",
          "chgp": "-7.24%",
          "chgp_class": "negative"
        },
        {
          "field": "Interest",
          "val1": "0.19",
          "val2": "0.40",
          "chgp": "-52.50%",
          "chgp_class": "positive"
        },
        {
          "field": "Exceptional Items",
          "val1": "-0.12",
          "val2": "-0.11",
          "chgp": "-9.09%",
          "chgp_class": "negative"
        },
        {
          "field": "Consolidate Net Profit",
          "val1": "9.52",
          "val2": "9.88",
          "chgp": "-3.64%",
          "chgp_class": "negative"
        },
        {
          "field": "Operating Profit Margin (Excl OI)",
          "val1": "9.25%",
          "val2": "10.23%",
          "chgp": "-0.98%",
          "chgp_class": "negative"
        }
      ]
    }
  },
  {
    "link": "half-yearly",
    "btn_text": "All Half Yearly Results",
    "header": "Half Yearly Results Snapshot (Consolidated) - Sep'25",
    "rhs": [
      {
        "prefix": "Net Sales ",
        "suffix": " Growth in half year ended Sep 2025 is -9.17% vs -8.88% in Sep 2024",
        "dir": -1
      },
      {
        "prefix": "Consolidated Net Profit ",
        "suffix": " Growth in half year ended Sep 2025 is -26.00% vs -2.65% in Sep 2024",
        "dir": -1
      }
    ],
    "table": {
      "header": [
        "Sep'25",
        "Sep'24",
        "Change(%)"
      ],
      "body": [
        {
          "field": "Net Sales",
          "val1": "206.24",
          "val2": "227.06",
          "chgp": "-9.17%",
          "chgp_class": "negative"
        },
        {
          "field": "Operating Profit (PBDIT) excl Other Income",
          "val1": "28.08",
          "val2": "27.83",
          "chgp": "0.90%",
          "chgp_class": "positive"
        },
        {
          "field": "Interest",
          "val1": "0.77",
          "val2": "0.31",
          "chgp": "148.39%",
          "chgp_class": "negative"
        },
        {
          "field": "Exceptional Items",
          "val1": "-0.27",
          "val2": "-0.25",
          "chgp": "-8.00%",
          "chgp_class": "negative"
        },
        {
          "field": "Consolidate Net Profit",
          "val1": "26.36",
          "val2": "35.62",
          "chgp": "-26.00%",
          "chgp_class": "negative"
        },
        {
          "field": "Operating Profit Margin (Excl OI)",
          "val1": "13.62%",
          "val2": "12.26%",
          "chgp": "1.36%",
          "chgp_class": "positive"
        }
      ]
    }
  },
  {
    "link": "nine-monthly",
    "btn_text": "All Nine Monthly Results",
    "header": "Nine Monthly Results Snapshot (Consolidated) - Dec'25",
    "rhs": [
      {
        "prefix": "Net Sales ",
        "suffix": "YoY Growth in nine months ended Dec 2025 is 5.51% vs -3.52% in Dec 2024",
        "dir": 1
      },
      {
        "prefix": "Consolidated Net Profit ",
        "suffix": "YoY Growth in nine months ended Dec 2025 is -3.49% vs 3.24% in Dec 2024",
        "dir": -1
      }
    ],
    "table": {
      "header": [
        "Dec'25",
        "Dec'24",
        "Change(%)"
      ],
      "body": [
        {
          "field": "Net Sales",
          "val1": "391.02",
          "val2": "370.59",
          "chgp": "5.51%",
          "chgp_class": "positive"
        },
        {
          "field": "Operating Profit (PBDIT) excl Other Income",
          "val1": "60.91",
          "val2": "53.23",
          "chgp": "14.43%",
          "chgp_class": "positive"
        },
        {
          "field": "Interest",
          "val1": "1.20",
          "val2": "0.64",
          "chgp": "87.50%",
          "chgp_class": "negative"
        },
        {
          "field": "Exceptional Items",
          "val1": "-0.42",
          "val2": "-0.36",
          "chgp": "-16.67%",
          "chgp_class": "negative"
        },
        {
          "field": "Consolidate Net Profit",
          "val1": "54.42",
          "val2": "56.39",
          "chgp": "-3.49%",
          "chgp_class": "negative"
        },
        {
          "field": "Operating Profit Margin (Excl OI)",
          "val1": "15.58%",
          "val2": "14.36%",
          "chgp": "1.22%",
          "chgp_class": "positive"
        }
      ]
    }
  },
  {
    "link": "annual",
    "btn_text": "All Annual Results",
    "header": "Annual Results Snapshot (Consolidated) - Mar'26",
    "rhs": [
      {
        "prefix": "Net Sales ",
        "suffix": "YoY Growth in year ended Mar 2026 is -6.70% vs 12.20% in Mar 2025",
        "dir": -1
      },
      {
        "prefix": "Consolidated Net Profit ",
        "suffix": "YoY Growth in year ended Mar 2026 is 2.30% vs 24.46% in Mar 2025",
        "dir": -1
      }
    ],
    "table": {
      "header": [
        "Mar'26",
        "Mar'25",
        "Change(%)"
      ],
      "body": [
        {
          "field": "Net Sales",
          "val1": "532.67",
          "val2": "570.94",
          "chgp": "-6.70%",
          "chgp_class": "negative"
        },
        {
          "field": "Operating Profit (PBDIT) excl Other Income",
          "val1": "90.94",
          "val2": "84.28",
          "chgp": "7.90%",
          "chgp_class": "positive"
        },
        {
          "field": "Interest",
          "val1": "1.76",
          "val2": "1.00",
          "chgp": "76.00%",
          "chgp_class": "negative"
        },
        {
          "field": "Exceptional Items",
          "val1": "-0.44",
          "val2": "-0.52",
          "chgp": "15.38%",
          "chgp_class": "positive"
        },
        {
          "field": "Consolidate Net Profit",
          "val1": "82.25",
          "val2": "80.40",
          "chgp": "2.30%",
          "chgp_class": "positive"
        },
        {
          "field": "Operating Profit Margin (Excl OI)",
          "val1": "17.07%",
          "val2": "14.76%",
          "chgp": "2.31%",
          "chgp_class": "positive"
        }
      ]
    }
  }
]

Quarterly Results Snapshot (Consolidated) - Jun'26 - YoYstock-summary

Jun'26
Jun'25
Change(%)
Net Sales
90.10
87.75
2.68%
Operating Profit (PBDIT) excl Other Income
8.33
8.98
-7.24%
Interest
0.19
0.40
-52.50%
Exceptional Items
-0.12
-0.11
-9.09%
Consolidate Net Profit
9.52
9.88
-3.64%
Operating Profit Margin (Excl OI)
9.25%
10.23%
-0.98%
Values in Rs Cr.
Direction Arrows
Net Sales

YoY Growth in quarter ended Jun 2026 is 2.68% vs 3.34% in Jun 2025

Direction Arrows
Consolidated Net Profit

YoY Growth in quarter ended Jun 2026 is -3.64% vs -16.41% in Jun 2025

Half Yearly Results Snapshot (Consolidated) - Sep'25stock-summary

Sep'25
Sep'24
Change(%)
Net Sales
206.24
227.06
-9.17%
Operating Profit (PBDIT) excl Other Income
28.08
27.83
0.90%
Interest
0.77
0.31
148.39%
Exceptional Items
-0.27
-0.25
-8.00%
Consolidate Net Profit
26.36
35.62
-26.00%
Operating Profit Margin (Excl OI)
13.62%
12.26%
1.36%
Values in Rs Cr.
Direction Arrows
Net Sales

Growth in half year ended Sep 2025 is -9.17% vs -8.88% in Sep 2024

Direction Arrows
Consolidated Net Profit

Growth in half year ended Sep 2025 is -26.00% vs -2.65% in Sep 2024

Nine Monthly Results Snapshot (Consolidated) - Dec'25stock-summary

Dec'25
Dec'24
Change(%)
Net Sales
391.02
370.59
5.51%
Operating Profit (PBDIT) excl Other Income
60.91
53.23
14.43%
Interest
1.20
0.64
87.50%
Exceptional Items
-0.42
-0.36
-16.67%
Consolidate Net Profit
54.42
56.39
-3.49%
Operating Profit Margin (Excl OI)
15.58%
14.36%
1.22%
Values in Rs Cr.
Direction Arrows
Net Sales

YoY Growth in nine months ended Dec 2025 is 5.51% vs -3.52% in Dec 2024

Direction Arrows
Consolidated Net Profit

YoY Growth in nine months ended Dec 2025 is -3.49% vs 3.24% in Dec 2024

Annual Results Snapshot (Consolidated) - Mar'26stock-summary

Mar'26
Mar'25
Change(%)
Net Sales
532.67
570.94
-6.70%
Operating Profit (PBDIT) excl Other Income
90.94
84.28
7.90%
Interest
1.76
1.00
76.00%
Exceptional Items
-0.44
-0.52
15.38%
Consolidate Net Profit
82.25
80.40
2.30%
Operating Profit Margin (Excl OI)
17.07%
14.76%
2.31%
Values in Rs Cr.
Direction Arrows
Net Sales

YoY Growth in year ended Mar 2026 is -6.70% vs 12.20% in Mar 2025

Direction Arrows
Consolidated Net Profit

YoY Growth in year ended Mar 2026 is 2.30% vs 24.46% in Mar 2025

stock-summaryCompany CV
About India Tourism Development Corporation Ltd stock-summary
stock-summary
India Tourism Development Corporation Ltd
Small Cap
Hotels & Resorts
India Tourism Development Corporation Limited (ITDC) was incorporated in March, 1965. The Company is running hotels, restaurants at various places for tourists, besides providing transport facilities.
Company Coordinates stock-summary
Company Details
SCOPE Complex, Core 8 6th Floor 7 Lodi Road New Delhi New Delhi : 110003
stock-summary
Tel: 91-11-24360249
stock-summary
vkjain@theashokgroup.com
Registrar Details
Karvy Computershare Pvt Ltd, Plot No 17-24 , Near Image Hospital,, Reliance Cybervilae,Vithalrao Nagar,, Madhapur, Hyderabad