
Compare Insolation Ener with Similar Stocks
Total Returns (Price + Dividend) 
Latest dividend: 0.1 per share ex-dividend date: Sep-16-2025
Risk Adjusted Returns v/s
Returns Beta

News
Insolation Energy Ltd is Rated Sell
Insolation Energy Ltd is rated Sell by MarketsMOJO, with this rating last updated on 25 May 2026. However, the analysis and financial metrics discussed here reflect the stock's current position as of 18 June 2026, providing investors with an up-to-date view of the company’s performance and outlook.
Read full news article
Insolation Energy Ltd is Rated Sell
Insolation Energy Ltd is rated Sell by MarketsMOJO, with this rating last updated on 25 May 2026. However, the analysis and financial metrics discussed here reflect the stock's current position as of 08 June 2026, providing investors with an up-to-date view of the company’s performance and outlook.
Read full news article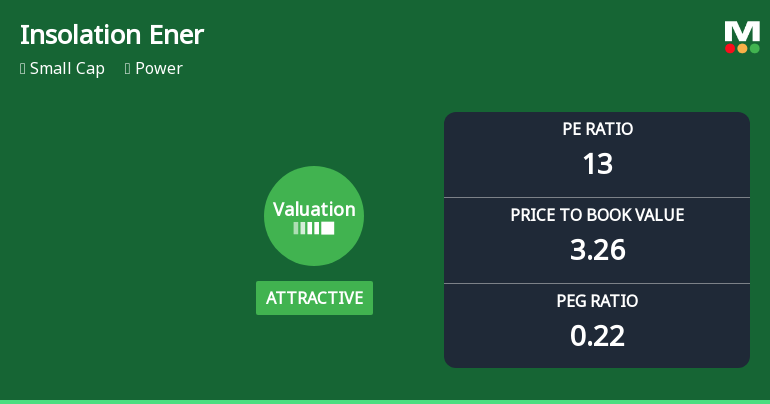
Insolation Energy Ltd Valuation Shifts Signal Renewed Price Attractiveness
Insolation Energy Ltd, a small-cap player in the power sector, has seen a notable shift in its valuation parameters, moving from a fair to an attractive rating. Despite recent price declines, the company’s price-to-earnings (P/E) and price-to-book value (P/BV) ratios now present a compelling case for investors seeking value in a volatile market environment.
Read full news article Announcements
Announcement under Regulation 30 (LODR)-Analyst / Investor Meet - Outcome
11-Jun-2026 | Source : BSEThis is further to the disclosure dated 08th June 2026 made by the Company. We wish to inform you that the Company representatives participated in the Analysts and Institutional Investors Meeting dated 11th June 2026 no Unpublished Price Sensitive Information (UPSI) was shared/discussed during the aforesaid meeting.
Announcement under Regulation 30 (LODR)-Analyst / Investor Meet - Intimation
08-Jun-2026 | Source : BSEPursuant to Regulation 30 read with Schedule III of the SEBI (Listing Obligations and Disclosure Requirements) Regulations 2015 this is to inform you that representatives of the Company will be interacting with Analysts and Institutional Investor as per the details mentioned in the letter. The aforesaid investor meetings are subject to end minute changes due to exigencies on the part of Investor(s) or the Company. Please note that no Unpublished Price Sensitive Information (UPSI) is proposed to be shared by the Company during the aforesaid investor meeting.
Announcement under Regulation 30 (LODR)-Analyst / Investor Meet - Intimation
08-Jun-2026 | Source : BSEPursuant to Regulation 30 read with Schedule III of the SEBI (Listing Obligations and Disclosure Requirements) Regulations 2015 this is to inform you that representatives of the Company will be interacting with Analysts and Institutional Investor as per the the details mentioned in the letter. The aforesaid investor meetings are subject to end minute changes due to exigencies on the part of Investor(s) or the Company. Please note that no Unpublished Price Sensitive Information (UPSI) is proposed to be shared by the Company during the aforesaid investor meeting.
Corporate Actions

No Upcoming Board Meetings

Insolation Energy Ltd has declared 10% dividend, ex-date: 16 Sep 25

Insolation Energy Ltd has announced 1:10 stock split, ex-date: 24 Jan 25

No Bonus history available

No Rights history available
Quality key factors
Valuation key factors
Technicals key factors
 Technical Indicator Scale: Bearish, Mildly Bearish, Sideways, Mildly Bullish, Bullish Turned
 Shareholding Snapshot : Mar 2026
Shareholding Compare (%holding)
Promoters
None
Held by 0 Schemes
Held by 12 FIIs (1.09%)
Manish Gupta (33.06%)
Siddhartha Sharma (1.55%)
22.53%
Quarterly Results Snapshot (Standalone) - Mar'26 - QoQ

QoQ Growth in quarter ended Mar 2026 is 51.18% vs -62.33% in Dec 2025

QoQ Growth in quarter ended Mar 2026 is -154.85% vs -36.54% in Dec 2025
Half Yearly Results Snapshot (Consolidated) - Sep'25
Growth in half year ended Sep 2025 is 7.62% vs 17.92% in Mar 2025
Growth in half year ended Sep 2025 is 23.32% vs 5.97% in Mar 2025
Nine Monthly Results Snapshot (Consolidated) - Dec'25
YoY Growth in nine months ended Dec 2025 is -3.83% vs 31.11% in Mar 2026
YoY Growth in nine months ended Dec 2025 is -0.24% vs 54.47% in Mar 2026
Annual Results Snapshot (Consolidated) - Mar'26
YoY Growth in year ended Mar 2026 is 60.90% vs 80.93% in Mar 2025
YoY Growth in year ended Mar 2026 is 59.76% vs 126.39% in Mar 2025
About Insolation Energy Ltd

Company Coordinates


