
Compare ISGEC Heavy with Similar Stocks
Dashboard
Poor long term growth as Net Sales has grown by an annual rate of 4.76% and Operating profit at 7.09% over the last 5 years
- PBT LESS OI(Q) At Rs 68.07 cr has Fallen at -46.44%
- PAT(Q) At Rs 73.23 cr has Fallen at -19.7%
- DEBT-EQUITY RATIO(HY) Highest at 0.35 times
Below par performance in long term as well as near term
Stock DNA
Construction
INR 6,234 Cr (Small Cap)
20.00
37
0.58%
0.19
11.17%
2.30
Total Returns (Price + Dividend) 
Latest dividend: 5 per share ex-dividend date: Sep-08-2025
Risk Adjusted Returns v/s
Returns Beta

News
ISGEC Heavy Engineering Ltd is Rated Sell
ISGEC Heavy Engineering Ltd is rated Sell by MarketsMOJO. This rating was last updated on 30 June 2026, reflecting a reassessment of the stock’s outlook. However, all fundamentals, returns, and financial metrics discussed here are current as of 23 July 2026, providing investors with the latest perspective on the company’s performance and prospects.
Read full news article
ISGEC Heavy Engineering Ltd is Rated Sell
ISGEC Heavy Engineering Ltd is rated 'Sell' by MarketsMOJO, with this rating last updated on 30 June 2026. However, the analysis and financial metrics presented here reflect the stock's current position as of 12 July 2026, providing investors with the most recent insights into the company’s performance and outlook.
Read full news article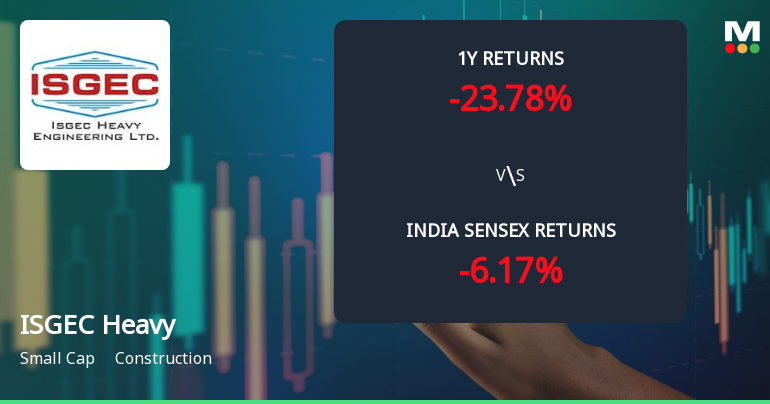
ISGEC Heavy Engineering Ltd Faces Mildly Bearish Momentum Amid Technical Downgrade
ISGEC Heavy Engineering Ltd has experienced a subtle shift in its technical momentum, moving from a sideways trend to a mildly bearish stance. Despite a marginal daily price increase, key indicators such as MACD, Bollinger Bands, and KST on weekly and monthly charts signal caution for investors, while daily moving averages offer a slight bullish counterpoint. This nuanced technical landscape, combined with the company’s recent downgrade to a Sell rating, paints a complex picture for stakeholders navigating the construction sector.
Read full news article Announcements
Corporate Actions

No Upcoming Board Meetings

ISGEC Heavy Engineering Ltd has declared 500% dividend, ex-date: 08 Sep 25

ISGEC Heavy Engineering Ltd has announced 1:10 stock split, ex-date: 28 Mar 19

No Bonus history available

No Rights history available
Quality key factors
Valuation key factors
Technicals key factors
 Technical Indicator Scale: Bearish, Mildly Bearish, Sideways, Mildly Bullish, Bullish Turned
 Shareholding Snapshot : Jun 2026
Shareholding Compare (%holding)
Promoters
None
Held by 7 Schemes (9.63%)
Held by 88 FIIs (3.76%)
The Yamuna Syndicate Ltd (45.0%)
Nippon Life India Trustee Ltd-a/c Nippon India Small Cap Fund (6.83%)
17.02%
Quarterly Results Snapshot (Consolidated) - Mar'26 - YoY

YoY Growth in quarter ended Mar 2026 is 17.42% vs -6.61% in Mar 2025

YoY Growth in quarter ended Mar 2026 is -19.71% vs 27.92% in Mar 2025
Half Yearly Results Snapshot (Consolidated) - Sep'25
Growth in half year ended Sep 2025 is -4.73% vs 11.32% in Sep 2024
Growth in half year ended Sep 2025 is -39.12% vs 43.07% in Sep 2024
Nine Monthly Results Snapshot (Consolidated) - Dec'25
YoY Growth in nine months ended Dec 2025 is 1.98% vs 7.50% in Dec 2024
YoY Growth in nine months ended Dec 2025 is -6.80% vs 3.32% in Dec 2024
Annual Results Snapshot (Consolidated) - Mar'26
YoY Growth in year ended Mar 2026 is 5.71% vs 3.26% in Mar 2025
YoY Growth in year ended Mar 2026 is -56.29% vs 2.27% in Mar 2025
About ISGEC Heavy Engineering Ltd

Company Coordinates


