Jayaswal Neco

  • Market Cap: Small Cap
  • Industry: Iron & Steel Products
  • ISIN: INE854B01010
  • NSEID: JAYNECOIND
  • BSEID: 522285
INR
89.15
-9.41 (-9.55%)
BSENSE

Sep 04, 04:01 PM

BSE+NSE Vol: 5.25 cr

  • Price Points
  • Score
  • Mojo Parameters
  • Total Return
  • News and Corporate Actions
  • Key factors
  • Shareholding
  • Financials
  • CompanyCV
stock-summaryPrice Point
High/Low

1Day

52 Week

Valuation
Technical
Day's Volume

CASH

5.25 cr (1,481.24%) Volume

Shareholding (Jun 2026)

FII

1.32%

Held by 31 FIIs

DII

0.78%

Held by 2 DIIs

Promoter

55.15%

Why is Jayaswal Neco Industries Ltd falling/rising?

04-Sep-2026

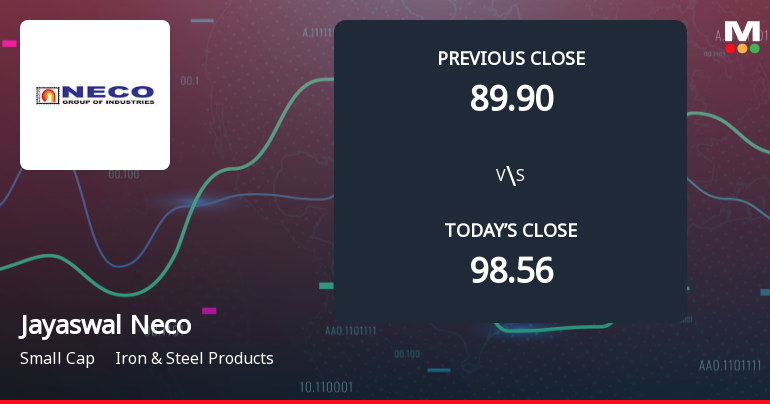
As of 03-Sep, Jayaswal Neco Industries Ltd's stock price is rising to Rs 98.56 due to a 108.47% increase in net profit and consistent positive results over six quarters. Strong operational performance and favorable valuation metrics further support this upward trend.

As of 03-Sep, Jayaswal Neco Industries Ltd is experiencing a rise in its stock price, currently at Rs 98.56, with a change of 0.54 (0.55%) upwards. This upward movement can be attributed to several positive factors. The company has reported a significant growth in net profit of 108.47% and has declared positive results for the last six consecutive quarters. Additionally, net sales for the latest six months have grown by 22.74%, indicating strong operational performance.<BR><BR>The stock has also demonstrated consistent returns, generating a remarkable 64.38% return over the past year, while outperforming the BSE500 in each of the last three annual periods. Furthermore, the stock's performance today has outperformed its sector by 0.71%, and it has gained 2.46% over the last two days, reflecting positive investor sentiment.<BR><BR>Despite a recent decline in investor participation, as indicated by a 31.83% drop in delivery volume compared to the five-day average, the overall financial health of the company, including a high return on capital employed (ROCE) of 21.00%, supports the stock's valuation. The stock is also trading at a discount compared to its peers' average historical valuations, which may attract more investors.<BR><BR>In summary, the combination of strong financial results, consistent performance, and favorable valuation metrics contributes to the rising stock price of Jayaswal Neco Industries Ltd.

View full answer

Who are in the management team of Jayaswal Neco?

01-Sep-2026

The management team of Jayaswal Neco includes Chairman Emeritus Basant Lall Shaw, Executive Chairman Arbind Jayaswal, Managing Director Ramesh Jayaswal, and Executive Director & COO Megh Pal Singh, along with several Independent Non-Executive Directors and Non-Executive Directors. Ashish Srivastava serves as the Company Secretary and Compliance Officer.

The management team of Jayaswal Neco includes the following key individuals:<BR><BR>1. **Basant Lall Shaw** - Chairman Emeritus<BR>2. **Arbind Jayaswal** - Executive Chairman<BR>3. **Ramesh Jayaswal** - Managing Director<BR>4. **Megh Pal Singh** - Executive Director & COO<BR>5. **Sangram K. Swain** - Additional Director & Executive Director<BR><BR>Additionally, the board features several Independent Non-Executive Directors, including:<BR>- **BK Agrawal**<BR>- **Ashwini Kumar**<BR>- **Manoj B Shah**<BR>- **Kumkum Rathi**<BR>- **Vinod Kumar Kathuria**<BR>- **R P Mohanka**<BR><BR>There are also Non-Executive Directors:<BR>- **Davinder Chugh**<BR>- **Atul Gupta**<BR><BR>Lastly, **Ashish Srivastava** serves as the Company Secretary and Compliance Officer. This diverse team plays a crucial role in guiding the company's strategic direction and operations.

View full answer

What does Jayaswal Neco do?

01-Sep-2026

Jayaswal Neco Industries Ltd manufactures alloy steels and iron & steel products and is categorized as a Small Cap company. As of June 2026, it reported net sales of ₹2,107 Cr and a net profit of ₹194 Cr, with a market cap of ₹9,445 Cr.

Overview: <BR>Jayaswal Neco Industries Ltd is engaged in the manufacturing of alloy steels and iron & steel products, operating within the Small Cap category of the Iron & Steel Products industry.<BR><BR>History: <BR>The company was initially incorporated as 'Jayaswals Neco Limited' in 1972 and changed its name to Jayaswal Neco Industries Ltd on September 7, 2007. The latest quarterly results reported net sales and net profit for June 2026.<BR><BR>Financial Snapshot: <BR>Most recent Net Sales: 2,107 Cr (Quarterly Results - Jun 2026) <BR>Most recent Net Profit: 194 Cr (Quarterly Results - Jun 2026) <BR>Market-cap value: INR 9,445 Cr (Small Cap)<BR><BR>Key Metrics: <BR>P/E: 17.00 <BR>Industry P/E: 25 <BR>Dividend Yield: 0.00% <BR>Debt-Equity: 0.65 <BR>Return on Equity: 20.11% <BR>Price to Book: 3.38 <BR><BR>Contact Details: <BR>Address: F/8 MIDC Industrial Area, Hingna Road Nagpur Maharashtra : 440016 <BR>Tel: 91-07104-237276/237471/237472 <BR>Email: contact@necoindia.com <BR>Website: http://www.necoindia.com

View full answer

Who are the peers of the Jayaswal Neco?

01-Sep-2026

Jayaswal Neco's peers include Jindal Saw, Ratnamani Metals, Godawari Power, Usha Martin, and others. Management risk varies from excellent to below average among peers, with Aeroflex showing the highest 1-year return at 208.41%, while Jayaswal Neco has a 1-year return of 70.22%.

Peers: The peers of Jayaswal Neco are Jindal Saw, Ratnamani Metals, Godawari Power, Usha Martin, Gallantt Ispat L, Mah. Seamless, Technocraf.Inds., Aeroflex, Shivalik Bimetal, and Man Industries.<BR><BR>Quality Snapshot: Excellent management risk is observed at Ratnamani Metals, Godawari Power, Usha Martin, and Shivalik Bimetal, while Good management risk is found at Technocraf.Inds. Average management risk is noted at Jindal Saw, Gallantt Ispat L, Mah. Seamless, Aeroflex, and Jayaswal Neco, and the rest. Below Average management risk is present at Man Industries. Growth ratings show that Excellent growth is only found at Gallantt Ispat L, while Below Average growth is observed at Jindal Saw, Ratnamani Metals, Godawari Power, Usha Martin, Mah. Seamless, Jayaswal Neco, and the rest. Good growth is noted at Technocraf.Inds. Capital Structure ratings indicate Excellent capital structure at Ratnamani Metals, Godawari Power, Usha Martin, Gallantt Ispat L, and Aeroflex, while Average capital structure is found at Jindal Saw and the rest, and Below Average at Jayaswal Neco.<BR><BR>Return Snapshot: The peer with the highest 1-year return is Aeroflex at 208.41%, while Gallantt Ispat L has the lowest at -1.62%. Jayaswal Neco's 1-year return of 70.22% is significantly higher than Gallantt Ispat L's but lower than Aeroflex's. Additionally, Godawari Power and Gallantt Ispat L have negative six-month returns.

View full answer

How big is Jayaswal Neco?

01-Sep-2026

As of 31st August, Jayaswal Neco Industries Ltd has a market capitalization of 9,445.00 Cr, with recent net sales of 7,589.03 Cr and a net profit of 564.01 Cr.

As of 31st August, Jayaswal Neco Industries Ltd has a market capitalization of 9,445.00 Cr, categorizing it as a Small Cap company.<BR><BR>In the latest four quarters, the company reported Net Sales of 7,589.03 Cr and a Net Profit of 564.01 Cr.<BR><BR>The latest annual period for the balance sheet is March 2016, with Shareholder's Funds amounting to 2,120.78 Cr and Total Assets valued at 7,097.51 Cr.

View full answer

Are Jayaswal Neco Industries Ltd latest results good or bad?

18-Jul-2026

Jayaswal Neco Industries Ltd's latest results are strong, with a net profit of ₹193.92 crores, up 108.45% year-on-year, and revenue growth of 27.72% to ₹2,106.56 crores. Despite a slight decline in operating margin, the company shows solid profitability and effective cost management, indicating a positive growth trajectory.

The latest results for Jayaswal Neco Industries Ltd are quite strong, indicating a positive performance. In Q1 FY27, the company reported a net profit of ₹193.92 crores, which is an impressive 108.45% increase year-on-year. Additionally, revenue grew by 27.72% compared to the same quarter last year, reaching ₹2,106.56 crores. This reflects the company's ability to capitalize on favorable market conditions and operational efficiencies.<BR><BR>While there was a slight decline in the operating margin to 18.78% from the previous quarter's 19.03%, this still represents a significant improvement from earlier periods. The company’s return on equity (ROE) stands at 16.56%, showcasing strong capital efficiency.<BR><BR>Overall, the results suggest that Jayaswal Neco is on a solid growth trajectory, with strong profitability metrics and effective cost management. The management's focus on operational discipline appears to be yielding positive results, making these results favorable for the company.

View full answer

Should I buy, sell or hold Jayaswal Neco Industries Ltd?

18-Jul-2026

When is the next results date for Jayaswal Neco Industries Ltd?

10-Jul-2026

The next results date for Jayaswal Neco Industries Ltd is July 17, 2026.

The next results date for Jayaswal Neco Industries Ltd is scheduled for July 17, 2026.

View full answer

Is Jayaswal Neco technically bullish or bearish?

25-Nov-2025

As of November 24, 2025, the trend is mildly bullish based on daily moving averages, but caution is warranted due to mixed signals from weekly indicators and a bearish monthly RSI.

As of 24 November 2025, the technical trend has changed from bullish to mildly bullish. The current stance is mildly bullish, supported by daily moving averages indicating a positive trend. However, the weekly MACD and KST are mildly bearish, which introduces some caution. The monthly MACD remains bullish, suggesting potential strength in the longer term. The RSI on the monthly timeframe is bearish, indicating weakness. Overall, while there are mixed signals, the daily indicators provide a more optimistic outlook, albeit with some underlying bearish pressures in the weekly timeframe.

View full answer

How has been the historical performance of Jayaswal Neco?

24-Nov-2025

Jayaswal Neco's historical performance from 2010 to 2016 showed significant fluctuations, with net sales peaking at 3,160.79 crore in 2014 before declining to 2,632.50 crore in 2016, while profitability turned negative in 2016 with a profit after tax of -93.59 crore. Despite increased total assets and liabilities, the company faced volatility in profitability and cash flow during this period.

Answer:<BR>The historical performance of Jayaswal Neco has shown significant fluctuations over the years, particularly from 2010 to 2016.<BR><BR>Breakdown:<BR>From March 2010 to March 2016, Jayaswal Neco's net sales increased from 1,787.41 crore to 2,632.50 crore in 2016, peaking at 3,160.79 crore in 2014 before declining in subsequent years. Other operating income has remained minimal, contributing slightly to total operating income, which reached a high of 3,161.05 crore in 2014 but fell to 2,632.62 crore by 2016. The company's total expenditure, excluding depreciation, rose from 1,497.20 crore in 2010 to 2,404.17 crore in 2016, reflecting increased operational costs. Operating profit (PBDIT) peaked at 400.09 crore in 2014 but dropped to 262.77 crore in 2016, while profit before tax turned negative in 2016 at -110.45 crore, following a profit of 15.65 crore in 2015. Consequently, profit after tax also fell sharply to -93.59 crore in 2016, down from a slight profit of 0.29 crore in 2015. The company's total assets increased from 2,807.46 crore in 2011 to 7,097.51 crore in 2016, with total liabilities also rising from 2,807.46 crore to 7,227.88 crore in the same period. Cash flow from operating activities improved to 520.82 crore in 2016, despite a net cash outflow of -12.52 crore, indicating challenges in financing activities. Overall, Jayaswal Neco's performance has been marked by volatility, particularly in profitability and cash flow, alongside a steady increase in assets and liabilities.

View full answer

Is Jayaswal Neco overvalued or undervalued?

11-Nov-2025

As of November 10, 2025, Jayaswal Neco is considered very expensive and overvalued with a PE ratio of 18.74, despite a strong year-to-date return of 86.38%, indicating that investors may be paying a premium not justified by its fundamentals compared to peers like JSW Steel and Tata Steel.

As of 10 November 2025, the valuation grade for Jayaswal Neco has moved from expensive to very expensive, indicating a significant shift in its perceived value. The company is currently considered overvalued. Key financial ratios include a PE ratio of 18.74, an EV to EBITDA of 7.70, and a ROE of 15.86%. <BR><BR>When compared to peers, Jayaswal Neco's valuation appears starkly higher; for instance, JSW Steel has a PE ratio of 47.11 and Tata Steel stands at 46.66, both categorized as expensive, while Jayaswal Neco remains at a much lower valuation yet is still classified as very expensive. Additionally, despite a strong year-to-date return of 86.38%, which outpaces the Sensex's 6.91%, the current valuation metrics suggest that investors may be paying a premium for the stock that is not justified by its fundamentals.

View full answer

Who are the top shareholders of the Jayaswal Neco?

17-Jul-2025

The top shareholders of Jayaswal Neco include Jayaswal Holdings Pvt Ltd with 5.75%, and Assets Care And Reconstruction Enterprise Ltd as the largest public shareholder at 26.45%. Individual investors hold 5.37%, while mutual funds and foreign institutional investors have negligible stakes.

The top shareholders of Jayaswal Neco primarily consist of promoters, with a significant portion of their holdings pledged. The promoter with the highest stake is Jayaswal Holdings Pvt Ltd, which holds 5.75% of the company. Additionally, the highest public shareholder is Assets Care And Reconstruction Enterprise Ltd, owning 26.45%. Individual investors collectively hold 5.37%, while mutual funds and foreign institutional investors have minimal holdings, with mutual funds holding 0% and FIIs holding 0.02%.

View full answer

Has Jayaswal Neco declared dividend?

06-Jun-2025

No Dividend History Available

iScoreScore
Click here to find our call on this stock
Strong Sell
Sell
Hold
Buy
Strong Buy

Dashboard

1

With a growth in Net Profit of 108.47%, the company declared Very Positive results in Jun 26

  • The company has declared positive results for the last 6 consecutive quarters
  • NET SALES(Latest six months) At Rs 4,080.80 cr has Grown at 22.74%
  • ROCE(HY) Highest at 21.00%
  • OPERATING PROFIT TO INTEREST(Q) Highest at 6.04 times
2

With ROCE of 21.9, it has a Fair valuation with a 2.5 Enterprise value to Capital Employed

3

Market Beating Performance

stock-summaryMojo Parameters

Mojo Parameters

Loading Valuation Snapshot...

Stock DNA

stock-summary
Industry

Iron & Steel Products

stock-summary
Market cap

INR 8,904 Cr (Small Cap)

stock-summary
P/E

17.00

stock-summary
Industry P/E

25

stock-summary
Dividend Yield

0.00%

stock-summary
Debt Equity

0.65

stock-summary
Return on Equity

20.11%

stock-summary
Price to Book

3.39

Revenue and Profits:
Net Sales:
2,107 Cr
(Quarterly Results - Jun 2026)
Net Profit:
194 Cr
stock-summaryTotal Returns
Total Returns (Price + Dividend) stock-summary
Dividend Yield (0%)
TimePeriod
Price Return
Dividend Return
Total Return
3 Months
-8.7%
0%
-8.7%
6 Months
19.2%
0%
19.2%
1 Year
50.59%
0%
50.59%
2 Years
89.2%
0%
89.2%
3 Years
147.23%
0%
147.23%
4 Years
277.75%
0%
277.75%
5 Years
285.93%
0%
285.93%

Jayaswal Neco for the last several years.

Risk Adjusted Returns v/s stock-summary
Returns Beta
Icon
Beta has not been calculated since enough price history is not available
stock-summaryNews & Corporate Actions

Announcements stock-summary

Announcement under Regulation 30 (LODR)-Newspaper Publication

21-Aug-2026 | Source : BSE

Newspaper Publication - Notice of Annual General Meeting

Notice Of Convening The 53Rd Annual General Meeting

20-Aug-2026 | Source : BSE

Notice of Convening the 53rd AGM of the Company on Saturday 12 September 2026.

Reg. 34 (1) Annual Report.

20-Aug-2026 | Source : BSE

Annual Report for the Financial Year ended 31st March 2026.

Corporate Actions stock-summary

stock-summary
BOARD MEETING

No Upcoming Board Meetings

stock-summary
DIVIDEND

No Dividend history available

stock-summary
SPLITS

No Splits history available

stock-summary
BONUS

No Bonus history available

stock-summary
RIGHTS

No Rights history available

stock-summaryKey Factors

Quality key factors stock-summary

Factor
Value
Sales Growth (5y)
9.65%
EBIT Growth (5y)
4.58%
EBIT to Interest (avg)
1.90
Debt to EBITDA (avg)
3.12
Net Debt to Equity (avg)
0.65
Sales to Capital Employed (avg)
1.28
Tax Ratio
24.09%
Dividend Payout Ratio
0
Pledged Shares
99.87%
Institutional Holding
2.09%
ROCE (avg)
21.18%
ROE (avg)
15.22%

Valuation key factors

Factor
Value
P/E Ratio
17
Industry P/E
25
Price to Book Value
3.39
EV to EBIT
10.38
EV to EBITDA
8.15
EV to Capital Employed
2.45
EV to Sales
1.51
PEG Ratio
0.12
Dividend Yield
NA
ROCE (Latest)
21.92%
ROE (Latest)
20.11%

Technicals key factors

Indicator
Weekly
Monthly
MACD
Bullish
Bullish
RSI
No Signal
No Signal
Bollinger Bands
Mildly Bullish
Bullish
Moving Averages
Bullish (Daily)
KST
Mildly Bearish
Bullish
Dow Theory
Mildly Bullish
No Trend
OBV
Bullish
No Trend
stock-summary Technical Indicator Scale: Bearish, Mildly Bearish, Sideways, Mildly Bullish, Bullish  Turned 
stock-summaryShareholding
Shareholding Snapshot : Jun 2026stock-summary
Shareholding Compare (%holding) stock-summary
Majority shareholders

Promoters

Pledged Promoter Holdings

99.8665

Mutual Funds

Held by 10 Schemes (0.15%)

FIIs

Held by 31 FIIs (1.32%)

Promoter with highest holding

Jayaswal Holdings Pvt Ltd (5.75%)

Highest Public shareholder

Efficient Structures Private Limited . (2.95%)

Individual Investors Holdings

22.03%

stock-summaryFinancial
[
  {
    "link": "quarterly",
    "btn_text": "All Quarterly Results",
    "header": "Quarterly Results Snapshot (Standalone) - Jun'26 - YoY",
    "rhs": [
      {
        "prefix": "Net Sales ",
        "suffix": "YoY Growth in quarter ended Jun 2026 is 27.72% vs 14.73% in Jun 2025",
        "dir": 1
      },
      {
        "prefix": "Standalone Net Profit ",
        "suffix": "YoY Growth in quarter ended Jun 2026 is 108.47% vs 393.62% in Jun 2025",
        "dir": -1
      }
    ],
    "table": {
      "header": [
        "Jun'26",
        "Jun'25",
        "Change(%)"
      ],
      "body": [
        {
          "field": "Net Sales",
          "val1": "2,106.56",
          "val2": "1,649.35",
          "chgp": "27.72%",
          "chgp_class": "positive"
        },
        {
          "field": "Operating Profit (PBDIT) excl Other Income",
          "val1": "395.61",
          "val2": "314.59",
          "chgp": "25.75%",
          "chgp_class": "positive"
        },
        {
          "field": "Interest",
          "val1": "65.53",
          "val2": "119.38",
          "chgp": "-45.11%",
          "chgp_class": "positive"
        },
        {
          "field": "Exceptional Items",
          "val1": "0.00",
          "val2": "0.00",
          "chgp": "",
          "chgp_class": "neutral"
        },
        {
          "field": "Standalone Net Profit",
          "val1": "193.92",
          "val2": "93.02",
          "chgp": "108.47%",
          "chgp_class": "positive"
        },
        {
          "field": "Operating Profit Margin (Excl OI)",
          "val1": "18.78%",
          "val2": "19.07%",
          "chgp": "-0.29%",
          "chgp_class": "negative"
        }
      ]
    }
  },
  {
    "link": "half-yearly",
    "btn_text": "All Half Yearly Results",
    "header": "Half Yearly Results Snapshot (Standalone) - Sep'25",
    "rhs": [
      {
        "prefix": "Net Sales ",
        "suffix": " Growth in half year ended Sep 2025 is 28.59% vs -10.06% in Sep 2024",
        "dir": 1
      },
      {
        "prefix": "Standalone Net Profit ",
        "suffix": " Growth in half year ended Sep 2025 is 400.73% vs -155.28% in Sep 2024",
        "dir": 1
      }
    ],
    "table": {
      "header": [
        "Sep'25",
        "Sep'24",
        "Change(%)"
      ],
      "body": [
        {
          "field": "Net Sales",
          "val1": "3,430.35",
          "val2": "2,667.62",
          "chgp": "28.59%",
          "chgp_class": "positive"
        },
        {
          "field": "Operating Profit (PBDIT) excl Other Income",
          "val1": "641.54",
          "val2": "334.38",
          "chgp": "91.86%",
          "chgp_class": "positive"
        },
        {
          "field": "Interest",
          "val1": "231.70",
          "val2": "288.78",
          "chgp": "-19.77%",
          "chgp_class": "positive"
        },
        {
          "field": "Exceptional Items",
          "val1": "0.00",
          "val2": "0.00",
          "chgp": "",
          "chgp_class": "neutral"
        },
        {
          "field": "Standalone Net Profit",
          "val1": "198.15",
          "val2": "-65.89",
          "chgp": "400.73%",
          "chgp_class": "positive"
        },
        {
          "field": "Operating Profit Margin (Excl OI)",
          "val1": "18.70%",
          "val2": "12.53%",
          "chgp": "6.17%",
          "chgp_class": "positive"
        }
      ]
    }
  },
  {
    "link": "nine-monthly",
    "btn_text": "All Nine Monthly Results",
    "header": "Nine Monthly Results Snapshot (Standalone) - Dec'25",
    "rhs": [
      {
        "prefix": "Net Sales ",
        "suffix": "YoY Growth in nine months ended Dec 2025 is 19.27% vs -4.37% in Dec 2024",
        "dir": 1
      },
      {
        "prefix": "Standalone Net Profit ",
        "suffix": "YoY Growth in nine months ended Dec 2025 is 2,365.94% vs -94.69% in Dec 2024",
        "dir": 1
      }
    ],
    "table": {
      "header": [
        "Dec'25",
        "Dec'24",
        "Change(%)"
      ],
      "body": [
        {
          "field": "Net Sales",
          "val1": "5,157.58",
          "val2": "4,324.46",
          "chgp": "19.27%",
          "chgp_class": "positive"
        },
        {
          "field": "Operating Profit (PBDIT) excl Other Income",
          "val1": "951.94",
          "val2": "598.18",
          "chgp": "59.14%",
          "chgp_class": "positive"
        },
        {
          "field": "Interest",
          "val1": "357.27",
          "val2": "428.81",
          "chgp": "-16.68%",
          "chgp_class": "positive"
        },
        {
          "field": "Exceptional Items",
          "val1": "-10.04",
          "val2": "0.00",
          "chgp": "",
          "chgp_class": "neutral"
        },
        {
          "field": "Standalone Net Profit",
          "val1": "272.24",
          "val2": "11.04",
          "chgp": "2,365.94%",
          "chgp_class": "positive"
        },
        {
          "field": "Operating Profit Margin (Excl OI)",
          "val1": "18.46%",
          "val2": "13.83%",
          "chgp": "4.63%",
          "chgp_class": "positive"
        }
      ]
    }
  },
  {
    "link": "annual",
    "btn_text": "All Annual Results",
    "header": "Annual Results Snapshot (Standalone) - Mar'26",
    "rhs": [
      {
        "prefix": "Net Sales ",
        "suffix": "YoY Growth in year ended Mar 2026 is 18.87% vs 1.12% in Mar 2025",
        "dir": 1
      },
      {
        "prefix": "Standalone Net Profit ",
        "suffix": "YoY Growth in year ended Mar 2026 is 311.00% vs -46.34% in Mar 2025",
        "dir": 1
      }
    ],
    "table": {
      "header": [
        "Mar'26",
        "Mar'25",
        "Change(%)"
      ],
      "body": [
        {
          "field": "Net Sales",
          "val1": "7,131.82",
          "val2": "5,999.73",
          "chgp": "18.87%",
          "chgp_class": "positive"
        },
        {
          "field": "Operating Profit (PBDIT) excl Other Income",
          "val1": "1,327.54",
          "val2": "939.69",
          "chgp": "41.27%",
          "chgp_class": "positive"
        },
        {
          "field": "Interest",
          "val1": "426.22",
          "val2": "562.38",
          "chgp": "-24.21%",
          "chgp_class": "positive"
        },
        {
          "field": "Exceptional Items",
          "val1": "-10.04",
          "val2": "0.00",
          "chgp": "",
          "chgp_class": "neutral"
        },
        {
          "field": "Standalone Net Profit",
          "val1": "463.11",
          "val2": "112.68",
          "chgp": "311.00%",
          "chgp_class": "positive"
        },
        {
          "field": "Operating Profit Margin (Excl OI)",
          "val1": "18.61%",
          "val2": "15.66%",
          "chgp": "2.95%",
          "chgp_class": "positive"
        }
      ]
    }
  }
]

Quarterly Results Snapshot (Standalone) - Jun'26 - YoYstock-summary

Jun'26
Jun'25
Change(%)
Net Sales
2,106.56
1,649.35
27.72%
Operating Profit (PBDIT) excl Other Income
395.61
314.59
25.75%
Interest
65.53
119.38
-45.11%
Exceptional Items
0.00
0.00
Standalone Net Profit
193.92
93.02
108.47%
Operating Profit Margin (Excl OI)
18.78%
19.07%
-0.29%
Values in Rs Cr.
Direction Arrows
Net Sales

YoY Growth in quarter ended Jun 2026 is 27.72% vs 14.73% in Jun 2025

Direction Arrows
Standalone Net Profit

YoY Growth in quarter ended Jun 2026 is 108.47% vs 393.62% in Jun 2025

Half Yearly Results Snapshot (Standalone) - Sep'25stock-summary

Sep'25
Sep'24
Change(%)
Net Sales
3,430.35
2,667.62
28.59%
Operating Profit (PBDIT) excl Other Income
641.54
334.38
91.86%
Interest
231.70
288.78
-19.77%
Exceptional Items
0.00
0.00
Standalone Net Profit
198.15
-65.89
400.73%
Operating Profit Margin (Excl OI)
18.70%
12.53%
6.17%
Values in Rs Cr.
Direction Arrows
Net Sales

Growth in half year ended Sep 2025 is 28.59% vs -10.06% in Sep 2024

Direction Arrows
Standalone Net Profit

Growth in half year ended Sep 2025 is 400.73% vs -155.28% in Sep 2024

Nine Monthly Results Snapshot (Standalone) - Dec'25stock-summary

Dec'25
Dec'24
Change(%)
Net Sales
5,157.58
4,324.46
19.27%
Operating Profit (PBDIT) excl Other Income
951.94
598.18
59.14%
Interest
357.27
428.81
-16.68%
Exceptional Items
-10.04
0.00
Standalone Net Profit
272.24
11.04
2,365.94%
Operating Profit Margin (Excl OI)
18.46%
13.83%
4.63%
Values in Rs Cr.
Direction Arrows
Net Sales

YoY Growth in nine months ended Dec 2025 is 19.27% vs -4.37% in Dec 2024

Direction Arrows
Standalone Net Profit

YoY Growth in nine months ended Dec 2025 is 2,365.94% vs -94.69% in Dec 2024

Annual Results Snapshot (Standalone) - Mar'26stock-summary

Mar'26
Mar'25
Change(%)
Net Sales
7,131.82
5,999.73
18.87%
Operating Profit (PBDIT) excl Other Income
1,327.54
939.69
41.27%
Interest
426.22
562.38
-24.21%
Exceptional Items
-10.04
0.00
Standalone Net Profit
463.11
112.68
311.00%
Operating Profit Margin (Excl OI)
18.61%
15.66%
2.95%
Values in Rs Cr.
Direction Arrows
Net Sales

YoY Growth in year ended Mar 2026 is 18.87% vs 1.12% in Mar 2025

Direction Arrows
Standalone Net Profit

YoY Growth in year ended Mar 2026 is 311.00% vs -46.34% in Mar 2025

stock-summaryCompany CV
About Jayaswal Neco Industries Ltd stock-summary
stock-summary
Jayaswal Neco Industries Ltd
Small Cap
Iron & Steel Products
Jayaswal Neco Industries Limited, initially incorporated in the name of 'Jayaswals Neco Limited' on November 28, 1972, was changed to its present name on September 7, 2007. The Company is engaged in manufacturing of alloy steels - wire rods, bars, bright bars along with steel billets, pig iron/skull, sponge iron, pellets and iron & steel castings and operate the manufacturing facilities in the states of Chhattisgarh and Maharashtra.
Company Coordinates stock-summary
Company Details
F/8 MIDC Industrial Area, Hingna Road Nagpur Maharashtra : 440016
stock-summary
Tel: 91-07104-237276/237471/237472
stock-summary
contact@necoindia.com
Registrar Details
Sharex Dynamic (India) Pvt Ltd , Unit -1, Luthra Ind. Premises , Safed Pool, Andheri-Kurla Road, Andheri (E), Mumbai