
Compare Kernex Microsys. with Similar Stocks
Stock DNA
Transport Services
INR 3,594 Cr (Small Cap)
41.00
20
0.00%
0.54
35.60%
14.52
Total Returns (Price + Dividend) 
Latest dividend: 1 per share ex-dividend date: Sep-20-2012
Risk Adjusted Returns v/s
Returns Beta

News
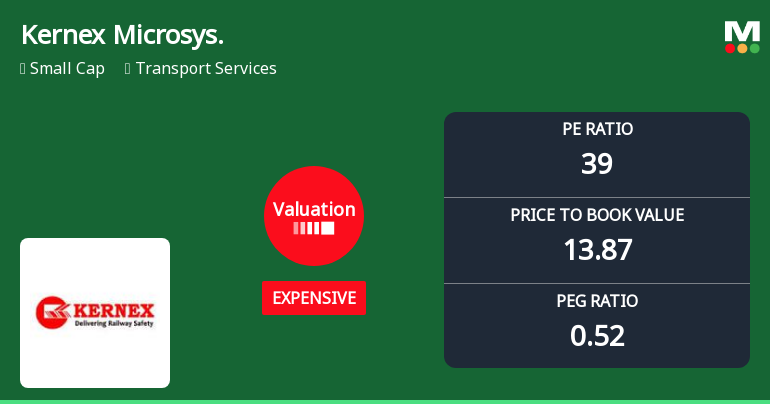
Kernex Microsystems Valuation Shifts Signal Price Attractiveness Amid Sector Dynamics
Kernex Microsystems (India) Ltd has experienced a notable shift in its valuation parameters, moving from a 'very expensive' to an 'expensive' rating, reflecting a subtle improvement in price attractiveness. Despite a recent 6.58% decline in its share price, the company’s robust financial metrics and strong returns relative to the Sensex underscore its potential within the transport services sector.
Read full news article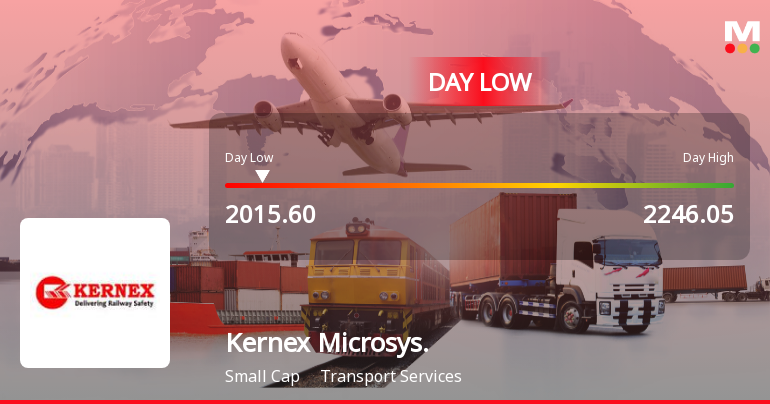
Kernex Microsystems (India) Ltd Hits Intraday Low Amid Price Pressure on 8 July 2026
Shares of Kernex Microsystems (India) Ltd declined sharply on 8 Jul 2026, hitting an intraday low of Rs 2,043.3, reflecting significant price pressure amid broader market weakness and sector underperformance.
Read full news article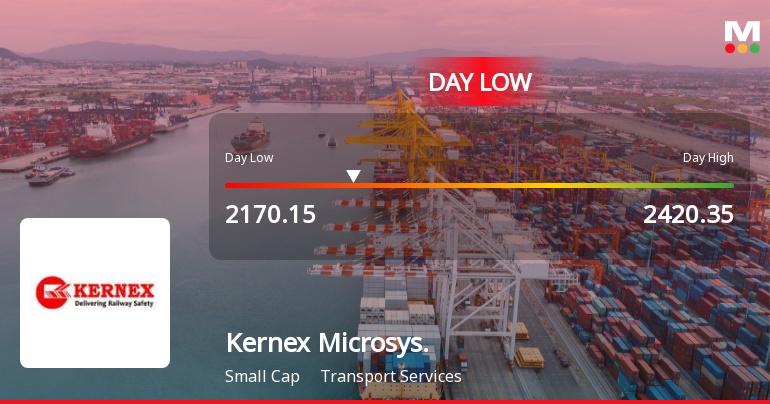
Kernex Microsystems (India) Ltd Hits Intraday Low Amid Price Pressure on 7 July 2026
Kernex Microsystems (India) Ltd experienced a notable decline today, touching an intraday low of Rs 2,242.95, reflecting a 6.72% drop as the stock faced significant price pressure amid broader market dynamics and sectoral movements.
Read full news article Announcements
Kernex Microsystems (India) Limited - Updates
15-Nov-2019 | Source : NSEKernex Microsystems (India) Limited has informed the Exchange regarding 'Disclosure under Regulation 30 of the Securities and Exchange Board of India (Listing Obligations and Disclosure Requirements) Regulations, 2015'.
Kernex Microsystems (India) Limited - Reply to Clarification Sought
30-Oct-2019 | Source : NSEKernex Microsystems (India) Limited (India) Limited with respect to announcement dated 12-Oct-2019, regarding resignation of Mr Dinakara Rao Pasupuleti as Non- Executive Independent Director of the company w.e.f. October 12, 2019. On basis of above the Company was required to clarify following: 1. Confirmation from the resigning director that there is no other material reasons other than provided.The response of the Company is attached.
Kernex Microsystems (India) Limited - Clarification
25-Oct-2019 | Source : NSEKernex Microsystems (India) Limited with respect to announcement dated 12-Oct-2019, regarding resignation of Mr Dinakara Rao Pasupuleti as Non- Executive Independent Director of the company w.e.f. October 12, 2019. On basis of above the Company is required to clarify following: 1. Confirmation from the resigning director that there is no other material reasons other than provided.The response of the Company is awaited.
Corporate Actions

No Upcoming Board Meetings

Kernex Microsystems (India) Ltd has declared 10% dividend, ex-date: 20 Sep 12

No Splits history available

Kernex Microsystems (India) Ltd has announced 1:10 bonus issue, ex-date: 16 Oct 07

No Rights history available
Quality key factors
Valuation key factors
Technicals key factors
 Technical Indicator Scale: Bearish, Mildly Bearish, Sideways, Mildly Bullish, Bullish Turned
 Shareholding Snapshot : Mar 2026
Shareholding Compare (%holding)
Non Institution
8.8352
Held by 0 Schemes
Held by 8 FIIs (0.3%)
Anji Raju Manthena (14.8%)
Mrt Signals Limited (2.58%)
51.76%
Quarterly Results Snapshot (Consolidated) - Mar'26 - QoQ

QoQ Growth in quarter ended Mar 2026 is 250.66% vs 54.07% in Dec 2025
QoQ Growth in quarter ended Mar 2026 is 1,030.13% vs -8.07% in Dec 2025
Half Yearly Results Snapshot (Consolidated) - Sep'25

Growth in half year ended Sep 2025 is 47.42% vs 2,849.37% in Sep 2024
Growth in half year ended Sep 2025 is 34.10% vs 297.92% in Sep 2024
Nine Monthly Results Snapshot (Consolidated) - Dec'25
YoY Growth in nine months ended Dec 2025 is 64.61% vs 899.16% in Dec 2024
YoY Growth in nine months ended Dec 2025 is 13.77% vs 227.99% in Dec 2024
Annual Results Snapshot (Consolidated) - Mar'26
YoY Growth in year ended Mar 2026 is 126.71% vs 868.21% in Mar 2025
YoY Growth in year ended Mar 2026 is 75.84% vs 290.23% in Mar 2025
About Kernex Microsystems (India) Ltd

Company Coordinates


