
Compare Khaitan Chemical with Similar Stocks
Dashboard
Weak Long Term Fundamental Strength with a 14.82% CAGR growth in Operating Profits over the last 5 years
- Low ability to service debt as the company has a high Debt to EBITDA ratio of 2.71 times
Despite the size of the company, domestic mutual funds hold only 0.02% of the company
Underperformed the market in the last 1 year
Total Returns (Price + Dividend) 
Latest dividend: 0.29985871271585557 per share ex-dividend date: Jul-21-2023
Risk Adjusted Returns v/s
Returns Beta

News

Khaitan Chemicals & Fertilizers Ltd is Rated Sell
Khaitan Chemicals & Fertilizers Ltd is rated 'Sell' by MarketsMOJO, with this rating last updated on 05 Jan 2026. However, the analysis and financial metrics discussed here reflect the stock's current position as of 21 June 2026, providing investors with an up-to-date view of the company’s fundamentals, returns, and market standing.
Read full news article
Khaitan Chemicals & Fertilizers Ltd is Rated Sell
Khaitan Chemicals & Fertilizers Ltd is rated Sell by MarketsMOJO. This rating was last updated on 05 January 2026, reflecting a shift from the previous 'Hold' status. However, all fundamentals, returns, and financial metrics discussed here are current as of 09 June 2026, providing investors with an up-to-date view of the stock's position in the market.
Read full news article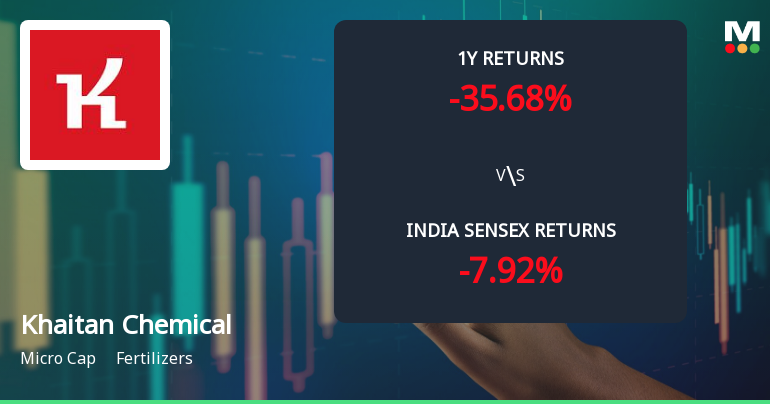
Khaitan Chemicals & Fertilizers Ltd Faces Bearish Momentum Amid Technical Downgrade
Khaitan Chemicals & Fertilizers Ltd has experienced a notable shift in its technical momentum, with key indicators signalling a bearish trend. Despite a modest daily price decline, the stock’s broader technical parameters reveal increasing downside pressure, prompting a downgrade in its mojo grade to Sell as of 5 January 2026.
Read full news article Announcements
Announcement under Regulation 30 (LODR)-Newspaper Publication
20-Jun-2026 | Source : BSENewspaper Publication before dispatch of Annual Report.
Communication To Shareholders - Intimation Of Tax Deduction On Dividend.
12-Jun-2026 | Source : BSECommunication to shareholders about intimation of Tax deduction on dividend.
Announcement under Regulation 30 (LODR)-Newspaper Publication
19-May-2026 | Source : BSECopy of newspaper publication about transfer of equity shares to IEPF & about special window for Re-lodgement of transfer request of physical shares.
Corporate Actions

No Upcoming Board Meetings

Khaitan Chemicals & Fertilizers Ltd has declared 30% dividend, ex-date: 21 Jul 23

Khaitan Chemicals & Fertilizers Ltd has announced 1:10 stock split, ex-date: 14 Sep 11

No Bonus history available

No Rights history available
Quality key factors
Valuation key factors
Technicals key factors
 Technical Indicator Scale: Bearish, Mildly Bearish, Sideways, Mildly Bullish, Bullish Turned
 Shareholding Snapshot : Mar 2026
Shareholding Compare (%holding)
Promoters
None
Held by 2 Schemes (0.0%)
Held by 3 FIIs (0.34%)
Shradha Projects Ltd (44.71%)
None
19.05%
Quarterly Results Snapshot (Standalone) - Mar'26 - YoY

YoY Growth in quarter ended Mar 2026 is 20.10% vs 216.11% in Mar 2025
YoY Growth in quarter ended Mar 2026 is -85.40% vs 123.07% in Mar 2025
Half Yearly Results Snapshot (Standalone) - Sep'25

Growth in half year ended Sep 2025 is 50.51% vs 1.05% in Sep 2024
Growth in half year ended Sep 2025 is 316.89% vs -223.73% in Sep 2024
Nine Monthly Results Snapshot (Standalone) - Dec'25
YoY Growth in nine months ended Dec 2025 is 44.53% vs 15.51% in Dec 2024
YoY Growth in nine months ended Dec 2025 is 976.07% vs 78.14% in Dec 2024
Annual Results Snapshot (Standalone) - Mar'26
YoY Growth in year ended Mar 2026 is 39.08% vs 34.40% in Mar 2025
YoY Growth in year ended Mar 2026 is 4,514.29% vs 101.99% in Mar 2025
About Khaitan Chemicals & Fertilizers Ltd

Company Coordinates


