
Compare Kilburn Engg. with Similar Stocks
Dashboard
With ROE of 14.7, it has a Expensive valuation with a 3.7 Price to Book Value
- The stock is trading at a premium compared to its peers' average historical valuations
- Over the past year, while the stock has generated a return of -13.82%, its profits have risen by 54% ; the PEG ratio of the company is 0.6
Underperformed the market in the last 1 year
Stock DNA
Industrial Manufacturing
INR 2,458 Cr (Small Cap)
25.00
37
0.42%
0.03
14.71%
3.73
Total Returns (Price + Dividend) 
Latest dividend: 2 per share ex-dividend date: Sep-18-2025
Risk Adjusted Returns v/s
Returns Beta

News
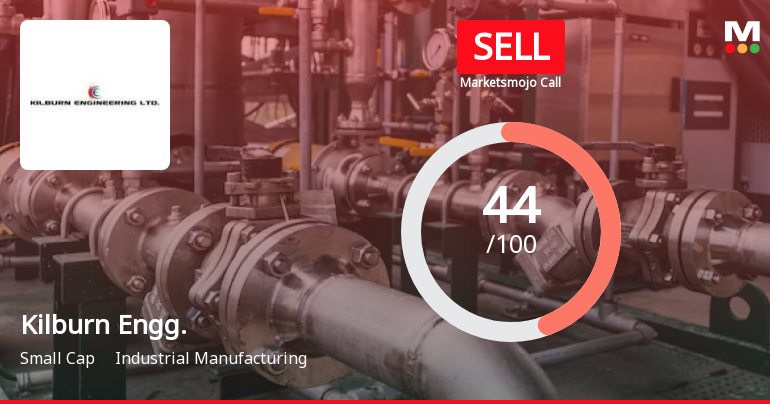
Kilburn Engineering Ltd is Rated Sell
Kilburn Engineering Ltd is rated 'Sell' by MarketsMOJO, with this rating last updated on 25 May 2026. However, the analysis and financial metrics discussed here reflect the stock's current position as of 21 July 2026, providing investors with an up-to-date view of the company’s performance and outlook.
Read full news article
Kilburn Engineering Ltd is Rated Sell
Kilburn Engineering Ltd is rated 'Sell' by MarketsMOJO, with this rating last updated on 25 May 2026. However, the analysis and financial metrics discussed here reflect the stock's current position as of 10 July 2026, providing investors with the most up-to-date view of the company’s fundamentals, returns, and market standing.
Read full news article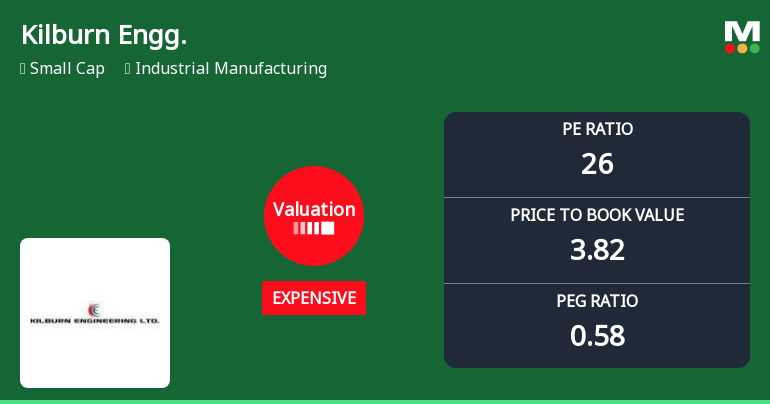
Kilburn Engineering Ltd Valuation Shifts Signal Price Attractiveness Change
Kilburn Engineering Ltd, a small-cap player in the industrial manufacturing sector, has experienced a notable shift in its valuation parameters, moving from a 'very expensive' to an 'expensive' rating. This change reflects evolving market perceptions and impacts the stock’s price attractiveness amid broader sector and peer comparisons.
Read full news article Announcements
Compliances-Certificate under Reg. 74 (5) of SEBI (DP) Regulations 2018
07-Jul-2026 | Source : BSEPursuant to Regulation 74(5) of the SEBI (Depositories and Participants) Regulations 2018 we are enclosing herewith the Compliance Certificate received from Maheshwari Datamatics Private Limited the Registrar and Share Transfer Agent of the Company for the quarter ended June 30 2026.
Closure of Trading Window
29-Jun-2026 | Source : BSEPursuant to the provisions of the SEBI (Prohibition of Insider Trading) Regulations 2015 as amended read with the Code of Conduct for Prevention of Insider Trading and Code of Practices and Procedures for Fair Disclosure of Unpublished Price Sensitive Information of the Company we wish to inform you that the Trading Window for dealing in the securities of the Company shall remain closed for all Designated Persons of the Company and their immediate relatives with effect from Wednesday 1st July 2026 and shall continue to remain closed until the expiry of 48 hours after the declaration of the Un-audited Financial Results (Standalone and Consolidated) of the Company for the quarter ending 30th June 2026.
Dispatch Of Communication To Physical Shareholders - KYC And Related Matters
26-Jun-2026 | Source : BSEPlease find the intimation of dispatch of communication to Physical Shareholders regarding KYC Updation Nomination Bank Mandate SEBI Special Window for Re-lodgement of Transfer Requests and Saksham Niveshak Investor Awareness Campaign and other related matters.
Corporate Actions

No Upcoming Board Meetings

Kilburn Engineering Ltd has declared 20% dividend, ex-date: 18 Sep 25

No Splits history available

No Bonus history available

Kilburn Engineering Ltd has announced 1:1 rights issue, ex-date: 27 Jan 06
Quality key factors
Valuation key factors
Technicals key factors
 Technical Indicator Scale: Bearish, Mildly Bearish, Sideways, Mildly Bullish, Bullish Turned
 Shareholding Snapshot : Jun 2026
Shareholding Compare (%holding)
Non Institution
17.3185
Held by 4 Schemes (5.97%)
Held by 6 FIIs (1.13%)
Firstview Trading Private Limited (29.27%)
Procheta Consultants Private Limited (12.52%)
18.76%
Quarterly Results Snapshot (Consolidated) - Mar'26 - YoY

YoY Growth in quarter ended Mar 2026 is 49.03% vs 4.46% in Mar 2025
YoY Growth in quarter ended Mar 2026 is 21.80% vs -11.68% in Mar 2025
Half Yearly Results Snapshot (Standalone) - Sep'25
Growth in half year ended Sep 2025 is 47.45% vs 5.11% in Sep 2024

Growth in half year ended Sep 2025 is 33.33% vs 43.34% in Sep 2024
Nine Monthly Results Snapshot (Standalone) - Dec'25
YoY Growth in nine months ended Dec 2025 is 34.97% vs 12.12% in Dec 2024
YoY Growth in nine months ended Dec 2025 is 23.50% vs 40.52% in Dec 2024
Annual Results Snapshot (Consolidated) - Mar'26
YoY Growth in year ended Mar 2026 is 48.14% vs 28.83% in Mar 2025
YoY Growth in year ended Mar 2026 is 54.44% vs 23.25% in Mar 2025
About Kilburn Engineering Ltd

Company Coordinates


