
 Price Point
Compare KIOCL with Similar Stocks
ScoreDashboard
With a Operating Losses, the company has a Weak Long Term Fundamental Strength
- Company's ability to service its debt is weak with a poor EBIT to Interest (avg) ratio of -7.31
- The company has been able to generate a Return on Equity (avg) of 3.11% signifying low profitability per unit of shareholders funds
Risky - Negative EBITDA
Despite the size of the company, domestic mutual funds hold only 0% of the company
Below par performance in long term as well as near term
Mojo ParametersStock DNA

Ferrous Metals

INR 21,046 Cr (Small Cap)

531.00
10

0.00%

-0.37

2.24%

12.29
Total ReturnsTotal Returns (Price + Dividend) 
Latest dividend: 0.7 per share ex-dividend date: Sep-08-2022
Risk Adjusted Returns v/s
Returns Beta
 News & Corporate Actions
News
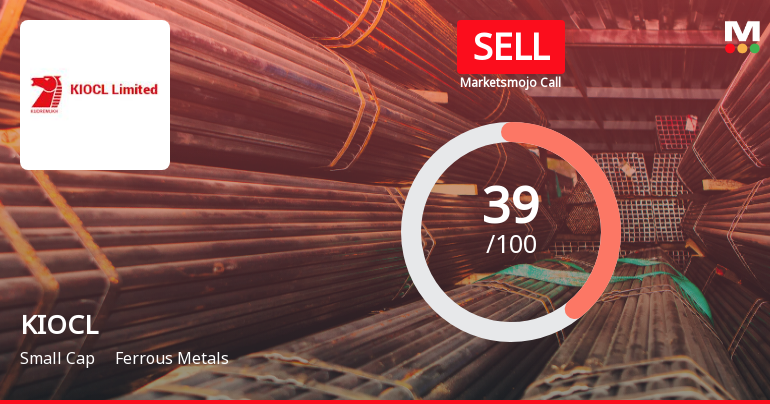
KIOCL Ltd Upgraded to Sell: Technical Improvements Drive Rating Change Amid Mixed Fundamentals
KIOCL Ltd, a small-cap player in the ferrous metals sector, has seen its investment rating upgraded from Strong Sell to Sell as of 23 September 2026. This change is primarily driven by a shift in technical indicators signalling a mildly bullish trend, despite ongoing fundamental weaknesses and operational challenges. The company’s stock price rose 1.66% on the day following the upgrade, reflecting cautious optimism among investors.
Read full news article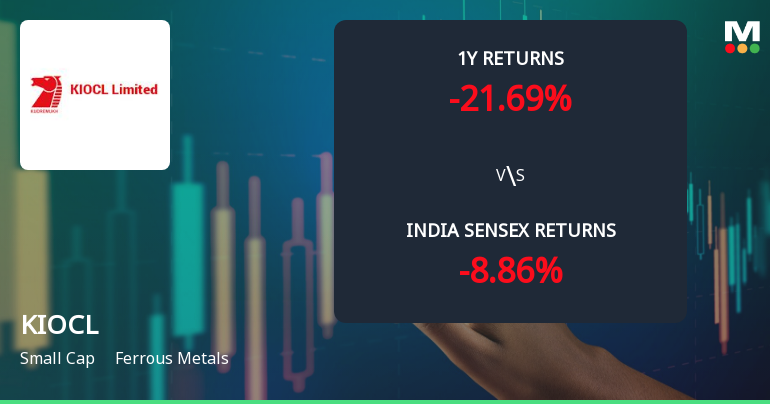
KIOCL Ltd Technical Momentum Shifts Amid Mixed Indicator Signals
KIOCL Ltd, a small-cap player in the ferrous metals sector, has exhibited a subtle shift in its technical momentum, moving from a sideways trend to a mildly bullish stance. Despite this positive tilt, the company’s overall technical indicators present a mixed picture, with several key metrics signalling caution amid sporadic bullish signals. This nuanced technical landscape is reflected in the recent upgrade of its MarketsMOJO grade from Strong Sell to Sell, underscoring a tentative improvement in outlook but still highlighting underlying risks.
Read full news article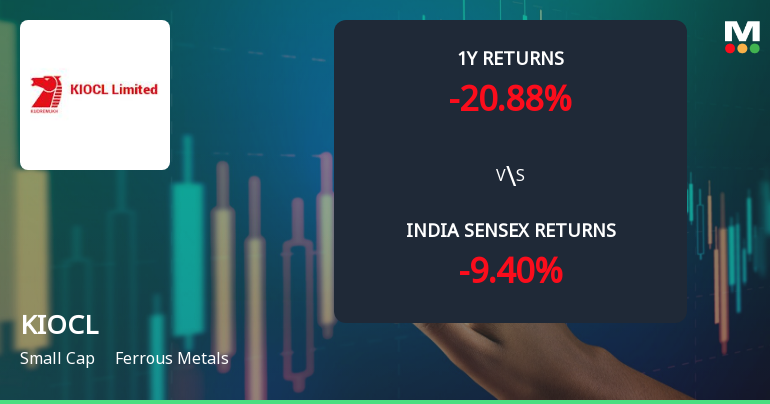
KIOCL Ltd Technical Momentum Shifts Amid Bearish Sentiment
KIOCL Ltd, a small-cap player in the ferrous metals sector, has experienced a notable shift in its technical momentum, moving from a mildly bearish stance to a sideways trend. Despite a marginal daily price increase of 0.19%, the company’s technical indicators reveal a complex picture of mixed signals, reflecting ongoing challenges in the broader market environment and sector-specific pressures.
Read full news article Announcements
Reg. 34 (1) Annual Report.
10-Sep-2026 | Source : BSEIn pursuance to Regulation 34 of SEBI (LODR) Regulations 2015 we enclose copy of Annual Report of FY 2025-26 inter-alia containing the Notice of 50th AGM of the Company which is being sent/dispatched to the Shareholders by permitted modes.
50Th AGM Of KIOCL Limited
08-Sep-2026 | Source : BSEThis is to bring to your kind notice that the 50th AGM of the company is scheduled to be held on Tuesday 29th September 2026 through VC/OAVM.
Board Meeting Outcome for Outcome Of Board Meeting- Regulation 30 Of SEBI (Listing Obligations And Disclosure Requirements) Regulations 2015.
13-Aug-2026 | Source : BSEWith reference to above we hereby inform that the Board of Directors at its Meeting held today i.e. on August 13 2026 has inter-alia approved: -
Corporate Actions

No Upcoming Board Meetings

KIOCL Ltd has declared 7% dividend, ex-date: 08 Sep 22

No Splits history available

No Bonus history available

No Rights history available
Key FactorsQuality key factors
Valuation key factors
Technicals key factors
 Technical Indicator Scale: Bearish, Mildly Bearish, Sideways, Mildly Bullish, Bullish Turned Shareholding
Shareholding Snapshot : Mar 2026
Shareholding Compare (%holding)
Promoters
None
Held by 1 Schemes (0.0%)
Held by 7 FIIs (0.04%)
President Of India (99.03%)
None
0.79%
FinancialQuarterly Results Snapshot (Standalone) - Jun'26 - YoY
 Compare with Peers
YoY Growth in quarter ended Jun 2026 is 73.78% vs -38.30% in Jun 2025
YoY Growth in quarter ended Jun 2026 is 59.04% vs 25.49% in Jun 2025

Half Yearly Results Snapshot (Standalone) - Sep'25
Growth in half year ended Sep 2025 is 43.04% vs -82.50% in Sep 2024
Growth in half year ended Sep 2025 is 54.18% vs -50.99% in Sep 2024
Nine Monthly Results Snapshot (Standalone) - Dec'25
YoY Growth in nine months ended Dec 2025 is 14.36% vs -76.80% in Dec 2024
YoY Growth in nine months ended Dec 2025 is 78.05% vs -315.15% in Dec 2024
Annual Results Snapshot (Standalone) - Mar'26
YoY Growth in year ended Mar 2026 is 3.51% vs -68.15% in Mar 2025
YoY Growth in year ended Mar 2026 is 108.10% vs -145.56% in Mar 2025
 Company CV
About KIOCL Ltd










