
Compare Mangal Credit with Similar Stocks
Dashboard
Weak Long Term Fundamental Strength with an average Return on Equity (ROE) of 7.88%
With a growth in Net Profit of 43.08%, the company declared Very Positive results in Mar 26
With ROE of 8.9, it has a Fair valuation with a 2.6 Price to Book Value
Majority shareholders : Promoters
Market Beating performance in long term as well as near term
Stock DNA
Non Banking Financial Company (NBFC)
INR 469 Cr (Micro Cap)
30.00
20
0.32%
1.92
8.85%
2.63
Total Returns (Price + Dividend) 
Latest dividend: 0.7 per share ex-dividend date: Sep-17-2025
Risk Adjusted Returns v/s
Returns Beta

News
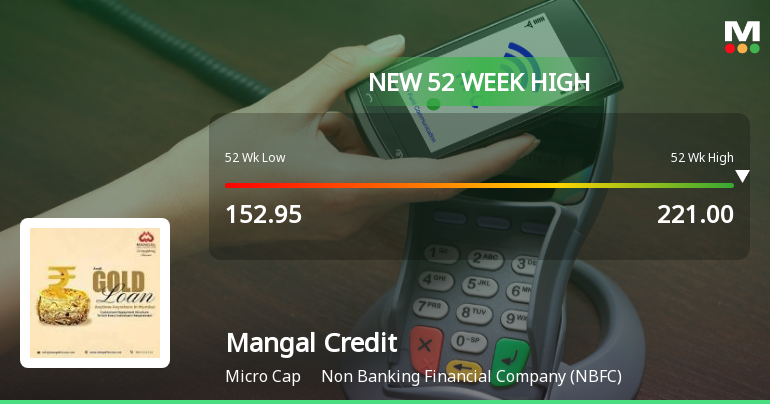
Broad-Based Technical Strength Lifts Mangal Credit & Fincorp Ltd to 52-Week High of Rs 222
With a decisive break above Rs 222 on 12 Jun 2026, Mangal Credit & Fincorp Ltd has reached a new 52-week high, propelled by a confluence of bullish technical indicators and sustained price momentum over the past week.
Read full news article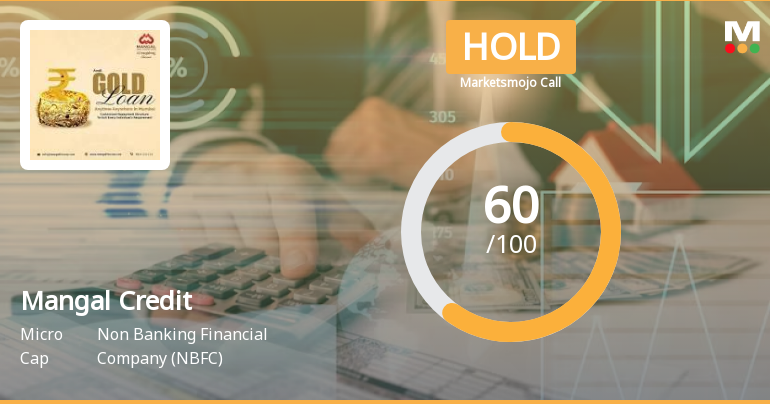
Mangal Credit & Fincorp Ltd is Rated Hold by MarketsMOJO
Mangal Credit & Fincorp Ltd is rated 'Hold' by MarketsMOJO, with this rating last updated on 29 May 2026. However, the analysis and financial metrics discussed here reflect the stock's current position as of 10 June 2026, providing investors with the most up-to-date view of the company’s performance and outlook.
Read full news article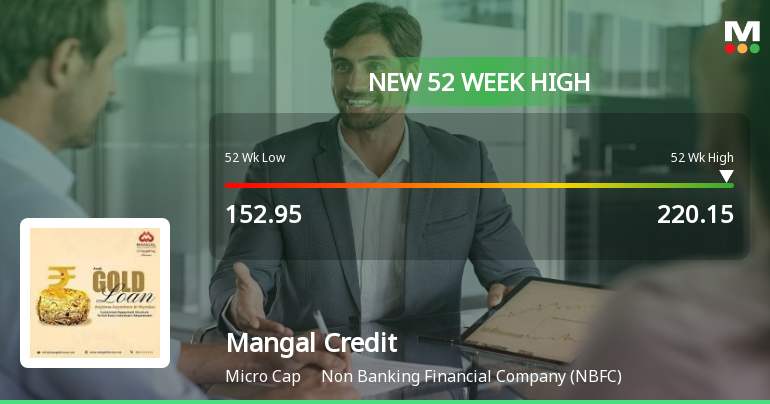
Broad-Based Technical Strength Lifts Mangal Credit & Fincorp Ltd to 52-Week High of Rs 220.15
With a decisive surge to Rs 220.15 on 01 Jun 2026, Mangal Credit & Fincorp Ltd has reached a fresh 52-week high, propelled by a confluence of bullish technical indicators and sustained price momentum over the past week.
Read full news article Announcements
Announcement under Regulation 30 (LODR)-Newspaper Publication
30-May-2026 | Source : BSEAttached herewith copies of the newspaper clippings published in News Hub and Pratahkal Marathi contain the extract of the Audited Financial Results for the quarter and financial year ended March 31 2026.
Compliances-Reg.24(A)-Annual Secretarial Compliance
29-May-2026 | Source : BSEEnclosed herewith Annual Secretarial Compliance Report for the year ended March 31 2026.
Board Meeting Outcome for Outcome Of The Board Meeting Held On May 28 2026.
28-May-2026 | Source : BSEEnclosed herewith outcome of the Board meeting held on May 28 2026.
Corporate Actions

No Upcoming Board Meetings

Mangal Credit & Fincorp Ltd has declared 7% dividend, ex-date: 17 Sep 25

Mangal Credit & Fincorp Ltd has announced 10:1 stock split, ex-date: 26 Nov 18

Mangal Credit & Fincorp Ltd has announced 5:1 bonus issue, ex-date: 17 Dec 15

No Rights history available
Quality key factors
Valuation key factors
Technicals key factors
 Technical Indicator Scale: Bearish, Mildly Bearish, Sideways, Mildly Bullish, Bullish Turned
 Shareholding Snapshot : Mar 2026
Shareholding Compare (%holding)
Promoters
None
Held by 0 Schemes
Held by 2 FIIs (0.0%)
Meghraj Sohanlal Jain (22.67%)
E Ally Consulting India Private Limited (7.96%)
22.93%
Quarterly Results Snapshot (Standalone) - Mar'26 - QoQ

QoQ Growth in quarter ended Mar 2026 is 16.33% vs 15.74% in Dec 2025
QoQ Growth in quarter ended Mar 2026 is 43.08% vs 28.52% in Dec 2025
Half Yearly Results Snapshot (Standalone) - Sep'25

Growth in half year ended Sep 2025 is 28.73% vs 55.93% in Sep 2024
Growth in half year ended Sep 2025 is -14.06% vs 36.67% in Sep 2024
Nine Monthly Results Snapshot (Standalone) - Dec'25
YoY Growth in nine months ended Dec 2025 is 34.22% vs 52.33% in Dec 2024
YoY Growth in nine months ended Dec 2025 is -6.03% vs 31.28% in Dec 2024
Annual Results Snapshot (Standalone) - Mar'26
YoY Growth in year ended Mar 2026 is 40.98% vs 49.34% in Mar 2025
YoY Growth in year ended Mar 2026 is 17.14% vs 23.89% in Mar 2025
About Mangal Credit & Fincorp Ltd

Company Coordinates


