
Compare Multi Comm. Exc. with Similar Stocks
Dashboard
Strong Long Term Fundamental Strength with an average Return on Equity (ROE) of 20.54%
- Healthy long term growth as Net Sales has grown by an annual rate of 42.59% and Operating profit at 44.74%
With a growth in Net Sales of 33.55%, the company declared Outstanding results in Mar 26
High Institutional Holdings at 80.44%
Consistent Returns over the last 3 years
Stock DNA
Capital Markets
INR 71,294 Cr (Mid Cap)
54.00
21
0.21%
0.00
46.75%
25.23
Total Returns (Price + Dividend) 
Latest dividend: 6 per share ex-dividend date: Aug-08-2025
Risk Adjusted Returns v/s
Returns Beta

News
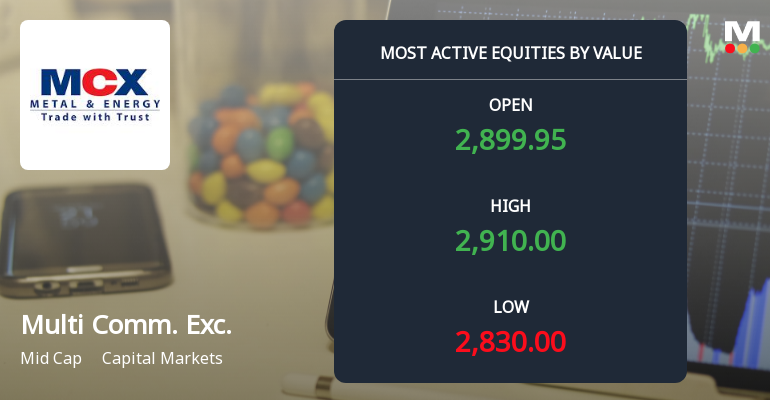
Multi Commodity Exchange of India Ltd Sees High-Value Trading Amid Mixed Market Signals
Multi Commodity Exchange of India Ltd (MCX), a prominent player in the capital markets sector, witnessed significant trading activity on 17 Jun 2026, registering one of the highest value turnovers in the equity segment. Despite a slight decline in price, institutional interest and liquidity metrics underscore the stock’s continued appeal among investors, reflecting a nuanced market sentiment amid broader sectoral and benchmark movements.
Read full news article
Multi Commodity Exchange of India Ltd Sees High-Value Trading Amid Mixed Market Signals
Multi Commodity Exchange of India Ltd (MCX), a prominent player in the capital markets sector, witnessed significant trading activity on 16 Jun 2026, with a total traded value exceeding ₹203.98 crores. Despite this robust turnover, the stock underperformed its sector and broader market indices, reflecting a nuanced investor sentiment amid shifting technical trends and rising institutional participation.
Read full news article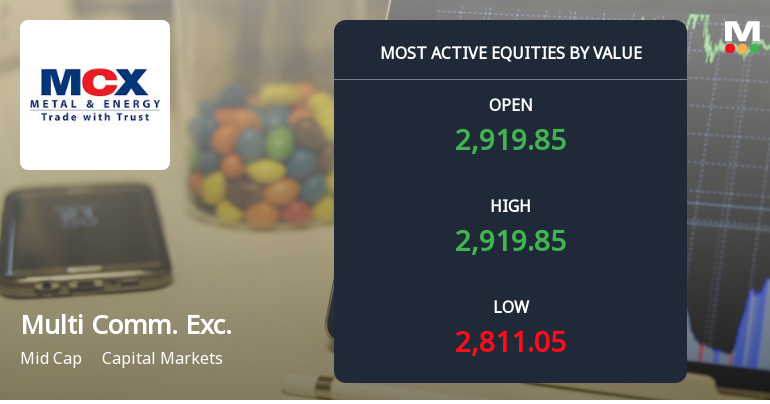
Multi Commodity Exchange of India Ltd Sees High-Value Trading Amid Mixed Market Sentiment
Multi Commodity Exchange of India Ltd (MCX), a prominent player in the capital markets sector, witnessed significant trading activity on 15 June 2026, with a total traded value exceeding ₹522.95 crores. Despite this high-value turnover, the stock underperformed its sector and broader indices, reflecting a nuanced market environment influenced by shifting investor participation and technical factors.
Read full news article Announcements
Incorporation Of Wholly Owned Subsidiary Company
12-Jun-2026 | Source : BSEIncorporation of wholly owned subsidiary company
Announcement under Regulation 30 (LODR)-Analyst / Investor Meet - Intimation
11-Jun-2026 | Source : BSEIntimation of schedule of Analyst / Investor Meeting
Announcement under Regulation 30 (LODR)-Analyst / Investor Meet - Intimation
05-Jun-2026 | Source : BSEIntimation of schedule of Analyst / Investor Meeting
Corporate Actions

No Upcoming Board Meetings

Multi Commodity Exchange of India Ltd has declared 300% dividend, ex-date: 08 Aug 25

Multi Commodity Exchange of India Ltd has announced 2:10 stock split, ex-date: 02 Jan 26

No Bonus history available

No Rights history available
Quality key factors
Valuation key factors
Technicals key factors
 Technical Indicator Scale: Bearish, Mildly Bearish, Sideways, Mildly Bullish, Bullish Turned
 Shareholding Snapshot : Mar 2026
Shareholding Compare (%holding)
Mutual Funds
None
Held by 45 Schemes (33.98%)
Held by 535 FIIs (26.08%)
None
Kotak Mahindra Bank Limited (15%)
15.51%
Quarterly Results Snapshot (Consolidated) - Mar'26 - QoQ

QoQ Growth in quarter ended Mar 2026 is 33.55% vs 77.86% in Dec 2025
QoQ Growth in quarter ended Mar 2026 is 32.07% vs 103.13% in Dec 2025
Half Yearly Results Snapshot (Consolidated) - Sep'25
Growth in half year ended Sep 2025 is 43.75% vs 67.25% in Sep 2024
Growth in half year ended Sep 2025 is 51.46% vs 44,737.29% in Sep 2024
Nine Monthly Results Snapshot (Consolidated) - Dec'25

YoY Growth in nine months ended Dec 2025 is 72.05% vs 63.48% in Dec 2024
YoY Growth in nine months ended Dec 2025 is 88.84% vs 9,019.75% in Dec 2024
Annual Results Snapshot (Consolidated) - Mar'26
YoY Growth in year ended Mar 2026 is 106.89% vs 62.78% in Mar 2025
YoY Growth in year ended Mar 2026 is 137.76% vs 573.85% in Mar 2025
About Multi Commodity Exchange of India Ltd

Company Coordinates


