
Compare Multi Comm. Exc. with Similar Stocks
Dashboard
Strong Long Term Fundamental Strength with an average Return on Equity (ROE) of 20.54%
- Healthy long term growth as Net Sales has grown by an annual rate of 42.59% and Operating profit at 44.74%
With a growth in Net Sales of 33.55%, the company declared Outstanding results in Mar 26
High Institutional Holdings at 80.44%
Consistent Returns over the last 3 years
Stock DNA
Capital Markets
INR 72,252 Cr (Mid Cap)
54.00
21
0.21%
0.00
46.75%
25.35
Total Returns (Price + Dividend) 
Latest dividend: 6 per share ex-dividend date: Aug-08-2025
Risk Adjusted Returns v/s
Returns Beta

News

Multi Commodity Exchange of India Ltd is Rated Strong Buy
Multi Commodity Exchange of India Ltd is rated Strong Buy by MarketsMOJO. This rating was last updated on 06 April 2026, reflecting a shift from the previous 'Buy' grade. However, all fundamentals, returns, and financial metrics discussed here are current as of 23 June 2026, providing investors with an up-to-date view of the stock’s performance and outlook.
Read full news article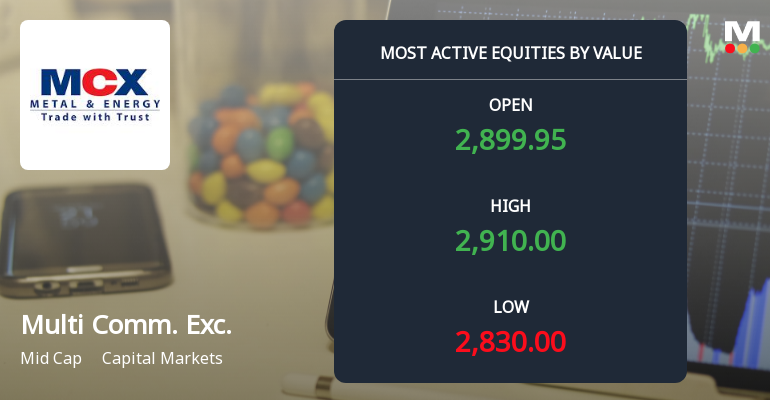
Multi Commodity Exchange of India Ltd Sees High-Value Trading Amid Mixed Market Signals
Multi Commodity Exchange of India Ltd (MCX), a prominent player in the capital markets sector, witnessed significant trading activity on 17 Jun 2026, registering one of the highest value turnovers in the equity segment. Despite a slight decline in price, institutional interest and liquidity metrics underscore the stock’s continued appeal among investors, reflecting a nuanced market sentiment amid broader sectoral and benchmark movements.
Read full news article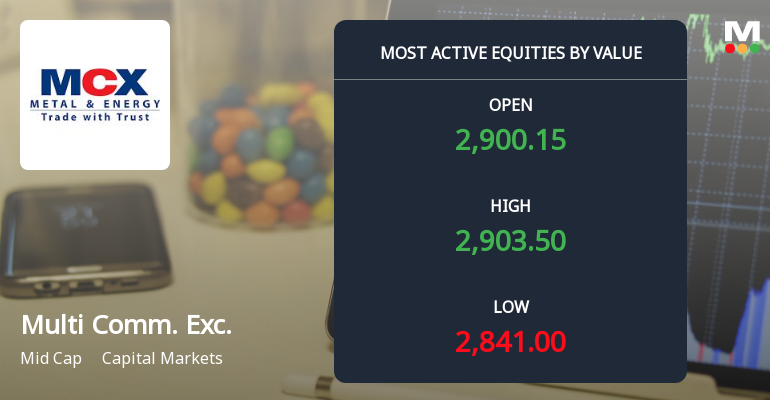
Multi Commodity Exchange of India Ltd Sees High-Value Trading Amid Mixed Market Signals
Multi Commodity Exchange of India Ltd (MCX), a prominent player in the capital markets sector, witnessed significant trading activity on 16 Jun 2026, with a total traded value exceeding ₹203.98 crores. Despite this robust turnover, the stock underperformed its sector and broader market indices, reflecting a nuanced investor sentiment amid shifting technical trends and rising institutional participation.
Read full news article Announcements
News Verification
30-Jun-2016 | Source : NSE
| The Exchange has sought clarification from Multi Commodity Exchange of India Limited, with respect to recent news item captioned "CME Group may pick up stake in MCX". The Exchange, in order to verify the accuracy or otherwise of the information reported in the media and to inform the market place so that the interest of the investors is safeguarded, had written to the company. The company has submitted its response. |
Spurt in Volume
10-Sep-2013 | Source : NSE
| Spurt in Volume : Substantial increase in trading volumes have been observed in Multi Commodity Exchange of India Limited.. The Exchange, in order to ensure that investors have latest relevant information about the company and to inform the market place so that the interest of the investors is safeguarded, had written to the company. Multi Commodity Exchange of India Limited has vide its letter inter-alia stated, "With regards to increase in volume / price, the Company would not like to speculate nor would like to comment on the increase in the volume / price in the recent past, as in our opinion there are no material information which may have a bearing on the price / volume in the scrip." |
News Verification
09-May-2013 | Source : NSE
| News Verification : The media had reports that Multi Commodity Exchange of India Limited is planning to sell its stake in Dubai Gold and Commodity Exchange(DGCX). The Exchange, in order to verify the accuracy or otherwise of the information reported in the media and to inform the market place so that the interest of the investors is safeguarded, had written to the company. Multi Commodity Exchange of India Limited has vide its letter inter-alia stated, "As a policy of the Company, we would not like to comment on rumours which are speculative in nature. Hence, we refrain from commenting on the said news article. As a responsible Corporate, we would like to assure you that the Company will at all times adhere to the compliance requirement in terms of the Listing Agreement in the larger interest of the shareholders and as best corporate governance practices." |
Corporate Actions

No Upcoming Board Meetings

Multi Commodity Exchange of India Ltd has declared 300% dividend, ex-date: 08 Aug 25

Multi Commodity Exchange of India Ltd has announced 2:10 stock split, ex-date: 02 Jan 26

No Bonus history available

No Rights history available
Quality key factors
Valuation key factors
Technicals key factors
 Technical Indicator Scale: Bearish, Mildly Bearish, Sideways, Mildly Bullish, Bullish Turned
 Shareholding Snapshot : Mar 2026
Shareholding Compare (%holding)
Mutual Funds
None
Held by 45 Schemes (33.98%)
Held by 535 FIIs (26.08%)
None
Kotak Mahindra Bank Limited (15%)
15.51%
Quarterly Results Snapshot (Consolidated) - Mar'26 - QoQ

QoQ Growth in quarter ended Mar 2026 is 33.55% vs 77.86% in Dec 2025
QoQ Growth in quarter ended Mar 2026 is 32.07% vs 103.13% in Dec 2025
Half Yearly Results Snapshot (Consolidated) - Sep'25
Growth in half year ended Sep 2025 is 43.75% vs 67.25% in Sep 2024
Growth in half year ended Sep 2025 is 51.46% vs 44,737.29% in Sep 2024
Nine Monthly Results Snapshot (Consolidated) - Dec'25

YoY Growth in nine months ended Dec 2025 is 72.05% vs 63.48% in Dec 2024
YoY Growth in nine months ended Dec 2025 is 88.84% vs 9,019.75% in Dec 2024
Annual Results Snapshot (Consolidated) - Mar'26
YoY Growth in year ended Mar 2026 is 106.89% vs 62.78% in Mar 2025
YoY Growth in year ended Mar 2026 is 137.76% vs 573.85% in Mar 2025
About Multi Commodity Exchange of India Ltd

Company Coordinates


