

Key Events This Week
1 June: Technical momentum shifts to sideways trend with mixed signals
2 June: Momentum turns mildly bearish amid cautious sentiment
4 June: Mojo Grade upgraded from Strong Sell to Sell amid technical stabilisation
5 June: Stock closes the week at ₹92.16, down 0.83% on the day
Nitco Ltd Gains 7.26%: 2 Key Technical Shifts Shape Weekly Performance
Key Events This Week
8 Jun: Stock opens at Rs.92.16, Sensex at 35,141.95
9 Jun: Downgrade to Strong Sell announced; stock closes Rs.94.10 (+2.11%)
11 Jun: Sharp intraday volatility; stock dips to Rs.93.88 (-3.47%)
12 Jun: Technical momentum shifts; stock closes Rs.98.85 (+5.29%)
Nitco Ltd Technical Momentum Shifts Amid Mixed Market Signals
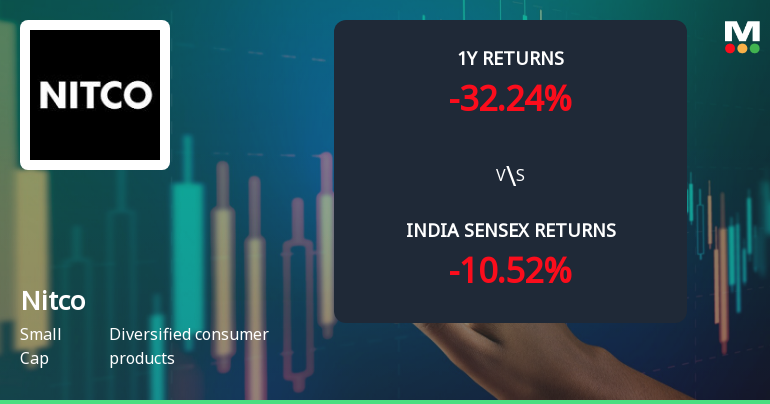
Nitco Ltd, a small-cap player in the diversified consumer products sector, has experienced a notable shift in its technical momentum, reflecting a complex interplay of bullish and bearish signals across multiple timeframes. Despite a recent downgrade to a Strong Sell rating by MarketsMOJO, the stock’s price action and technical indicators suggest a sideways trend with pockets of bullish momentum, warranting a detailed analysis for investors navigating current market conditions.
Read full news article Announcements 
Announcement under Regulation 30 (LODR)-Change in Management
11-Jun-2026 | Source : BSEChange in Management
Announcement under Regulation 30 (LODR)-Resignation of Company Secretary / Compliance Officer
11-Jun-2026 | Source : BSEResignation of Company Secretary & Compliance Officer (KMP)
Announcement under Regulation 30 (LODR)-Newspaper Publication
27-May-2026 | Source : BSENewspaper publication of notice of postal ballot & Intimation of remote E-voting information
Corporate Actions

No Upcoming Board Meetings

Nitco Ltd has declared 5% dividend, ex-date: 20 Sep 11

No Splits history available

No Bonus history available

No Rights history available
Quality key factors
Valuation key factors
Technicals key factors
 Technical Indicator Scale: Bearish, Mildly Bearish, Sideways, Mildly Bullish, Bullish Turned
 Shareholding Snapshot : Mar 2026
Shareholding Compare (%holding)
Non Institution
67.1294
Held by 0 Schemes
Held by 10 FIIs (2.3%)
Melisma Finance And Trading Pvt Ltd (10.68%)
Authum Investment And Infrastructure Limited (46.77%)
17.07%
Quarterly Results Snapshot (Consolidated) - Mar'26 - QoQ

QoQ Growth in quarter ended Mar 2026 is 15.61% vs 22.34% in Dec 2025

QoQ Growth in quarter ended Mar 2026 is 35.04% vs -1,290.00% in Dec 2025
Half Yearly Results Snapshot (Consolidated) - Sep'25
Growth in half year ended Sep 2025 is 89.32% vs -21.24% in Sep 2024
Growth in half year ended Sep 2025 is 162.12% vs -21.29% in Sep 2024
Nine Monthly Results Snapshot (Consolidated) - Dec'25
YoY Growth in nine months ended Dec 2025 is 76.43% vs -12.86% in Dec 2024
YoY Growth in nine months ended Dec 2025 is 104.96% vs -583.42% in Dec 2024
Annual Results Snapshot (Consolidated) - Mar'26
YoY Growth in year ended Mar 2026 is 72.40% vs -3.33% in Mar 2025
YoY Growth in year ended Mar 2026 is 103.90% vs -354.78% in Mar 2025
About Nitco Ltd

Company Coordinates


