
Compare Pondy Oxides with Similar Stocks
Dashboard
High Management Efficiency with a high ROCE of 15.61%
Strong ability to service debt as the company has a low Debt to EBITDA ratio of 0.72 times
Healthy long term growth as Net Sales has grown by an annual rate of 38.51% and Operating profit at 78.31%
With a growth in Net Sales of 19.91%, the company declared Outstanding results in Mar 26
Majority shareholders : Non Institution
Consistent Returns over the last 3 years
Stock DNA
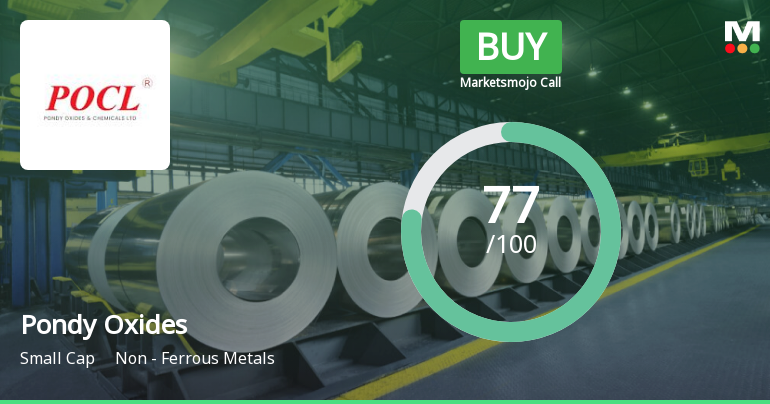
Non - Ferrous Metals
INR 3,847 Cr (Small Cap)
27.00
41
0.30%
0.18
16.82%
4.59
Total Returns (Price + Dividend) 
Latest dividend: 3.5 per share ex-dividend date: Sep-11-2025
Risk Adjusted Returns v/s
Returns Beta

News
Pondy Oxides & Chemicals Ltd Upgraded to Buy on Strong Financials and Bullish Technicals
Pondy Oxides & Chemicals Ltd has been upgraded from a Hold to a Buy rating, reflecting significant improvements across technical indicators, financial trends, valuation metrics, and overall quality. The company’s robust quarterly results, sustained growth trajectory, and positive technical signals have collectively driven this upgrade, signalling renewed investor confidence in this small-cap player within the non-ferrous metals sector.
Read full news article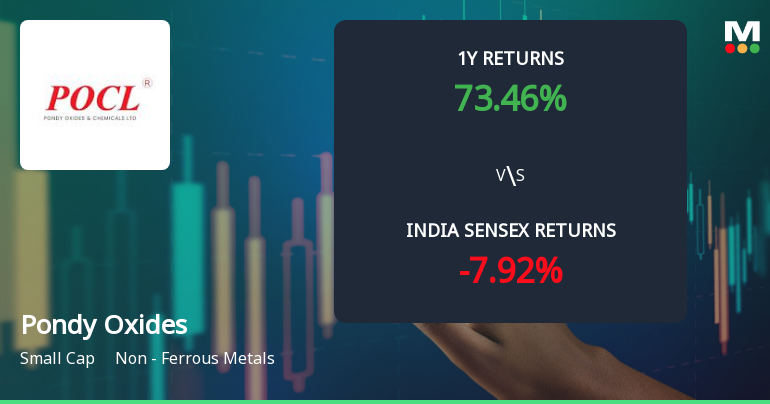
Pondy Oxides & Chemicals Ltd Technical Momentum Shifts Signal Cautious Optimism
Pondy Oxides & Chemicals Ltd, a small-cap player in the Non-Ferrous Metals sector, has experienced a notable shift in its technical momentum, moving from a sideways trend to a bullish stance. Despite a recent downgrade in its Mojo Grade from Buy to Hold, the stock’s technical indicators present a complex picture, with weekly signals largely bullish while monthly indicators show mild bearishness. This article analyses the recent price action, key technical parameters, and the implications for investors amid a volatile market backdrop.
Read full news article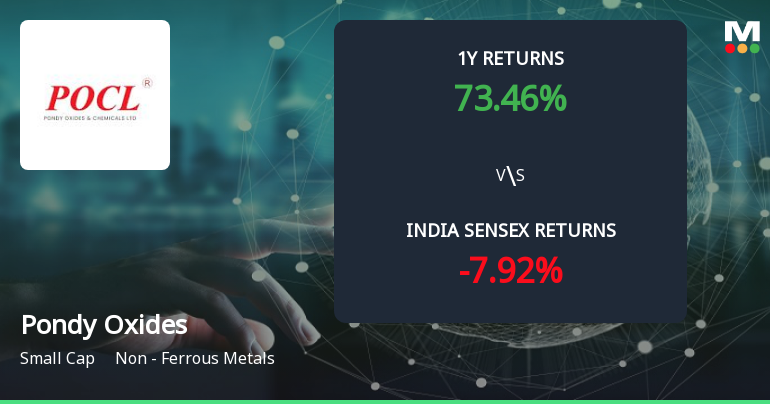
Pondy Oxides & Chemicals Ltd Forms Golden Cross Amid Mixed Technical Signals
The 50-day moving average for Pondy Oxides & Chemicals Ltd has crossed above the 200-day moving average, creating a golden cross on 3 Jun 2026. Yet, the stock fell 1.67% on the day this crossover occurred, and monthly momentum indicators remain mildly bearish. This juxtaposition of signals calls for a detailed examination of the technical and fundamental backdrop to assess the signal’s reliability.
Read full news article Announcements
Amalgamation/Merger
01-Jan-2015 | Source : NSE
| Pondy Oxides & Chemicals Limited has informed the Exchange regarding record date for allotment of shares pursuant to the Scheme of Demarger. The Board of Directors of the company in their meeting held on December 30,2014 has fixed the Record Date as January 9, 2015. Further, the company also informed that the following course of action is adopted for the purposes of allotment of shares under the aforesaid approved Scheme: 1. The Board of M/s POCL Enterprises Limited will allot 1(one) equity share of Rs.10/-each of its company for every 2(two) equity shares of Rs.10/- each held in Pondy Oxides and Chemicals Limited 2. The Board of M/s Pondy Oxides and Chemicals Limited will cancel 1(one) equity share of Rs.10/- each held in its company for every 1(one) equity share of Rs.10/- each allotted by M/s POCL Enterprises Limited and the paid up capital of M/s Pondy Oxides will accordingly be reduced. (Source MSE) |
Results
01-Aug-2014 | Source : NSE
| Pondy Oxides & Chemicals Limited has informed the Exchange regarding the consolidated financial information for the quarter ended on 30th June 2014 as follows: Total Operating Income of Rs. 11485.37 lacs; Profit from ordinary activities before tax of Rs.309.27 lakhs and Net Profit for the period of Rs. 208.77 lacs. (Source MSE) |
Dividend
05-Jun-2014 | Source : NSE
| Pondy Oxides & Chemicals Limited has informed the Exchange that the Board of Directors of the Company, in their meeting held on 28th May 2014, recommended dividend of 10% for the year ended 31st March 2014. (Source MSE) |
Corporate Actions

No Upcoming Board Meetings

Pondy Oxides & Chemicals Ltd has declared 70% dividend, ex-date: 11 Sep 25

Pondy Oxides & Chemicals Ltd has announced 5:10 stock split, ex-date: 16 Oct 24

Pondy Oxides & Chemicals Ltd has announced 1:1 bonus issue, ex-date: 28 Sep 22

Pondy Oxides & Chemicals Ltd has announced 2:3 rights issue, ex-date: 23 Jun 06
Quality key factors
Valuation key factors
Technicals key factors
 Technical Indicator Scale: Bearish, Mildly Bearish, Sideways, Mildly Bullish, Bullish Turned
 Shareholding Snapshot : Mar 2026
Shareholding Compare (%holding)
Non Institution
None
Held by 1 Schemes (1.73%)
Held by 44 FIIs (2.22%)
Ashish Bansal (15.2%)
Maneesh Parmar (3.35%)
39.81%
Quarterly Results Snapshot (Consolidated) - Mar'26 - QoQ

QoQ Growth in quarter ended Mar 2026 is 19.91% vs 21.79% in Dec 2025

QoQ Growth in quarter ended Mar 2026 is 6.29% vs 4.25% in Dec 2025
Half Yearly Results Snapshot (Consolidated) - Sep'25
Growth in half year ended Sep 2025 is 21.40% vs 41.88% in Sep 2024
Growth in half year ended Sep 2025 is 109.29% vs 188.15% in Sep 2024
Nine Monthly Results Snapshot (Consolidated) - Dec'25
YoY Growth in nine months ended Dec 2025 is 31.95% vs 30.03% in Dec 2024
YoY Growth in nine months ended Dec 2025 is 127.68% vs 108.03% in Dec 2024
Annual Results Snapshot (Consolidated) - Mar'26
YoY Growth in year ended Mar 2026 is 43.83% vs 33.42% in Mar 2025
YoY Growth in year ended Mar 2026 is 127.17% vs 82.15% in Mar 2025
About Pondy Oxides & Chemicals Ltd

Company Coordinates


