
Compare Prem. Explosives with Similar Stocks
Dashboard
Strong ability to service debt as the company has a low Debt to EBITDA ratio of 0.84 times
Healthy long term growth as Operating profit has grown by an annual rate 94.60%
Flat results in Mar 26
With ROE of 17.3, it has a Very Expensive valuation with a 14.4 Price to Book Value
Majority shareholders : Non Institution
Market Beating performance in long term as well as near term
Stock DNA
Other Chemical products
INR 4,097 Cr (Small Cap)
83.00
43
0.07%
-0.10
17.28%
13.84
Total Returns (Price + Dividend) 
Latest dividend: 0.5001273452754903 per share ex-dividend date: Sep-23-2025
Risk Adjusted Returns v/s
Returns Beta

News

Premier Explosives Ltd is Rated Hold
Premier Explosives Ltd is rated 'Hold' by MarketsMOJO, with this rating last updated on 08 June 2026. However, the analysis and financial metrics discussed here reflect the stock's current position as of 20 June 2026, providing investors with an up-to-date view of the company’s performance and outlook.
Read full news article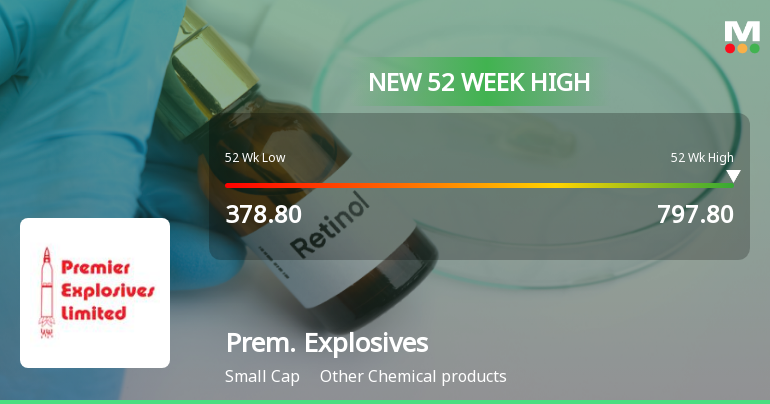
Broad-Based Technical Strength Lifts Premier Explosives Ltd to 52-Week High of Rs 797.8
Surging past its previous peaks, Premier Explosives Ltd touched a new 52-week high of Rs 797.8 on 19 Jun 2026, marking a significant milestone in its price momentum. This advance comes amid a backdrop of strong technical signals that have aligned to propel the stock well above its key moving averages.
Read full news article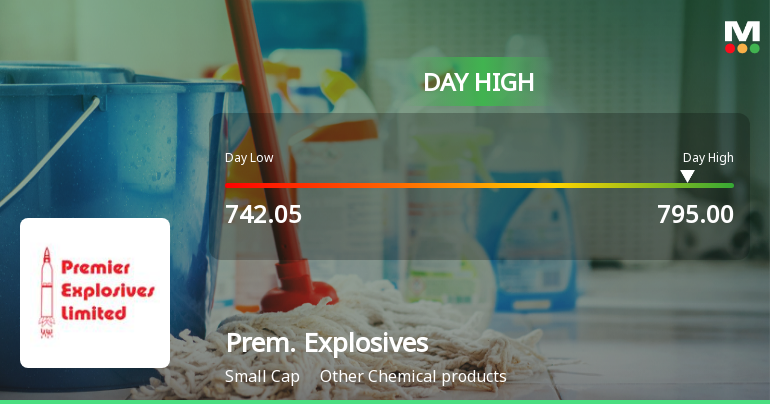
Premier Explosives Ltd Surges 7.27% to Day's High of Rs 794 — Outperforms Sector by 5.97 Percentage Points
While the Sensex declined by 1.01% on 19 Jun 2026, Premier Explosives Ltd surged 7.27%, touching a day high of Rs 794 and outperforming its sector by nearly 6 percentage points. This sharp single-session gain stands out as a significant stock-specific event amid a broadly weak market backdrop.
Read full news article Announcements
Premier Explosives Limited - Updates
27-Nov-2019 | Source : NSEPremier Explosives Limited has informed the Exchange regarding 'This is to inform you that the Company has bagged an Order from Elmas Savunma Sanayii Ve Havacilik Ticaret Limited, Ankara, Turkey'.
Premier Explosives Limited - Other General Purpose
18-Nov-2019 | Source : NSEPremier Explosives Limited has informed the Exchange regarding disclosure of related party transactions pursuant to Regulation 23(9) of SEBI (Listing Obligations and Disclosure Requirements) Regulation, 2015 (SEBI "Listing Regulation").
Premier Explosives Limited - Investor Presentation
15-Nov-2019 | Source : NSEPremier Explosives Limited has informed the Exchange regarding Investor Presentation
Corporate Actions

No Upcoming Board Meetings

Premier Explosives Ltd has declared 25% dividend, ex-date: 23 Sep 25

Premier Explosives Ltd has announced 2:10 stock split, ex-date: 21 Jun 24

No Bonus history available

No Rights history available
Quality key factors
Valuation key factors
Technicals key factors
 Technical Indicator Scale: Bearish, Mildly Bearish, Sideways, Mildly Bullish, Bullish Turned
 Shareholding Snapshot : Mar 2026
Shareholding Compare (%holding)
Non Institution
None
Held by 2 Schemes (9.1%)
Held by 31 FIIs (1.18%)
Kailash Gupta And Shonika Prasad (in The Capacity As Trustees Of Aks Family Trust) (41.33%)
Hdfc Mutual Fund - Hdfc Defence Fund (9.09%)
36.3%
Quarterly Results Snapshot (Consolidated) - Mar'26 - YoY

YoY Growth in quarter ended Mar 2026 is 20.42% vs -14.64% in Mar 2025
YoY Growth in quarter ended Mar 2026 is 75.94% vs -44.59% in Mar 2025
Half Yearly Results Snapshot (Consolidated) - Sep'25

Growth in half year ended Sep 2025 is 22.69% vs 26.42% in Sep 2024
Growth in half year ended Sep 2025 is 110.67% vs -20.90% in Sep 2024
Nine Monthly Results Snapshot (Consolidated) - Dec'25
YoY Growth in nine months ended Dec 2025 is -12.88% vs 85.68% in Dec 2024
YoY Growth in nine months ended Dec 2025 is 57.21% vs 15.50% in Dec 2024
Annual Results Snapshot (Consolidated) - Mar'26
YoY Growth in year ended Mar 2026 is -6.97% vs 53.63% in Mar 2025
YoY Growth in year ended Mar 2026 is 59.62% vs 1.20% in Mar 2025
About Premier Explosives Ltd

Company Coordinates


