
Compare Ramchandra Leas. with Similar Stocks
Dashboard
Weak Long Term Fundamental Strength with an average Return on Equity (ROE) of 0.35%
- Poor long term growth as Operating profit has grown by an annual rate of 9.99%
The company has declared Positive results for the last 3 consecutive quarters
With ROE of 3.5, it has a Very Expensive valuation with a 9.1 Price to Book Value
Majority shareholders : Promoters
Market Beating performance in long term as well as near term
Stock DNA
Non Banking Financial Company (NBFC)
INR 120 Cr (Micro Cap)
260.00
20
0.00%
0.00
3.51%
9.15
Total Returns (Price + Dividend) 
Ramchandra Leas. for the last several years.
Risk Adjusted Returns v/s
Returns Beta

News

Broad-Based Technical Strength Lifts Ramchandra Leasing and Finance Ltd to 52-Week High of Rs 14.77
Surging past its previous peaks, Ramchandra Leasing and Finance Ltd touched a new 52-week high of Rs 14.77 on 1 Jun 2026, marking a remarkable ascent from its 52-week low of Rs 2.80. This rally has been fuelled by a confluence of strong technical signals and sustained price momentum, setting the stock apart in a market where the broader Sensex remains subdued.
Read full news article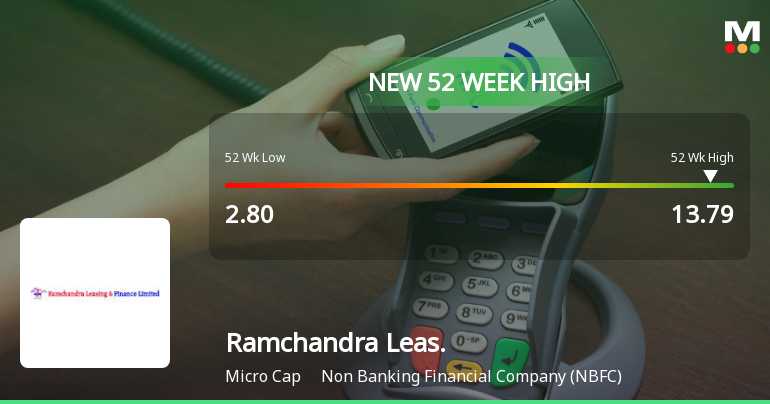
Broad-Based Technical Strength Lifts Ramchandra Leasing and Finance Ltd to 52-Week High of Rs 13.79
Surging to a new 52-week high of Rs 13.79 on 29 Jun 2026, Ramchandra Leasing and Finance Ltd has demonstrated remarkable price momentum, rallying over 330% in the past year despite a broadly subdued market environment.
Read full news article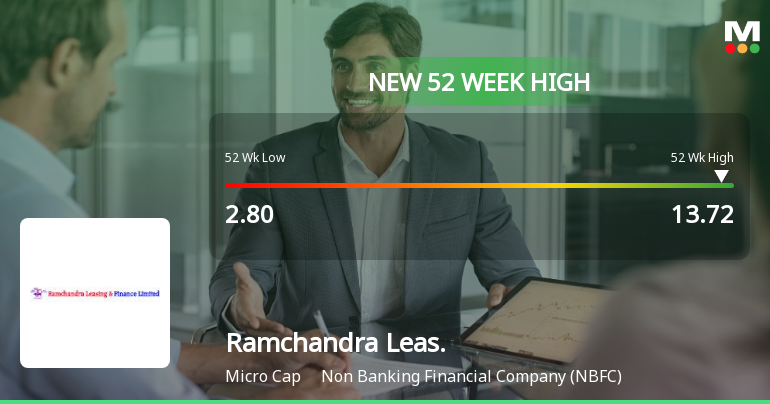
Broad-Based Technical Strength Lifts Ramchandra Leasing and Finance Ltd to 52-Week High of Rs 13.72
From a low of Rs 2.80 to a fresh peak of Rs 13.72, Ramchandra Leasing and Finance Ltd has surged over 300% in the past year, showcasing a remarkable price momentum that culminated in a new 52-week high on 27 Jun 2026. This rally is underpinned by a confluence of bullish technical indicators, signalling sustained strength despite a broadly subdued market backdrop.
Read full news article Announcements
Newspaper Publication
30-May-2026 | Source : BSEAudited Standalone Financial Statement for the quarter and financial year ended 31st March 2026 as published in the newspapers
Financial Results
30-May-2026 | Source : BSEFinancial Results for the quarter and financial year ended 31st March 2026
Board Meeting Outcome for Outcome Of Board Meeting Held On May 29 2026
29-May-2026 | Source : BSEPursuant to Regulations 30 and 33 of the Securities and Exchange Board of India (Listing Obligations and Disclosure Requirements) Regulations 2015 (Listing Regulations) we wish to inform you that the Board of Directors of the Company at its meeting held today i.e. Friday May 29 2026 has inter-alia considered and approved the Financial Statement for the Quarter ended March 31 2026 alongwith other agenda Items.:
Corporate Actions

No Upcoming Board Meetings

No Dividend history available

No Splits history available

No Bonus history available

No Rights history available
Quality key factors
Valuation key factors
Technicals key factors
 Technical Indicator Scale: Bearish, Mildly Bearish, Sideways, Mildly Bullish, Bullish Turned
 Shareholding Snapshot : Mar 2026
Shareholding Compare (%holding)
Promoters
None
Held by 0 Schemes
Held by 0 FIIs
Pratika Sharma (27.46%)
None
38.09%
Quarterly Results Snapshot (Standalone) - Mar'26 - YoY

YoY Growth in quarter ended Mar 2026 is 32,000.00% vs -91.67% in Mar 2025
YoY Growth in quarter ended Mar 2026 is 26,200.00% vs 0.00% in Mar 2025
Half Yearly Results Snapshot (Standalone) - Sep'25

Growth in half year ended Sep 2025 is 88.89% vs 350.00% in Sep 2024
Growth in half year ended Sep 2025 is 0.00% vs 0.00% in Sep 2024
Nine Monthly Results Snapshot (Standalone) - Dec'25
YoY Growth in nine months ended Dec 2025 is 614.71% vs 240.00% in Dec 2024
YoY Growth in nine months ended Dec 2025 is 0.00% vs 0.00% in Dec 2024
Annual Results Snapshot (Standalone) - Mar'26
YoY Growth in year ended Mar 2026 is 3,073.68% vs -17.39% in Mar 2025
YoY Growth in year ended Mar 2026 is 16,100.00% vs 0.00% in Mar 2025
About Ramchandra Leasing and Finance Ltd

Company Coordinates


