
Compare RBL Bank with Similar Stocks
Dashboard
With a growth in Operating Profit of 10.94%, the company declared Very Positive results in Mar 26
- The company has declared positive results for the last 2 consecutive quarters
- PAT(Latest six months) At Rs 443.59 cr has Grown at 337.77%
- GROSS NPA(Q) Lowest at 1.45%
- NII(Q) Highest at Rs 1,670.96 cr
Rising Promoter Confidence
Market Beating performance in long term as well as near term
Total Returns (Price + Dividend) 
Latest dividend: 1 per share ex-dividend date: Sep-08-2025
Risk Adjusted Returns v/s
Returns Beta

News
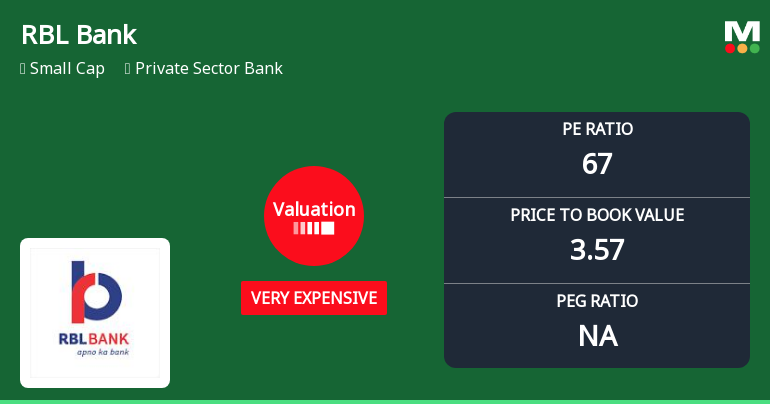
RBL Bank Ltd Valuation Shifts to Very Expensive Amid Strong Market Returns
RBL Bank Ltd has witnessed a significant shift in its valuation parameters, moving from an expensive to a very expensive rating, driven by a sharp rise in its price-to-earnings (P/E) and price-to-book value (P/BV) ratios. Despite this, the private sector bank has delivered robust returns well above the Sensex benchmark, prompting an upgrade in its Mojo Grade to Buy from Hold as of 5 January 2026.
Read full news article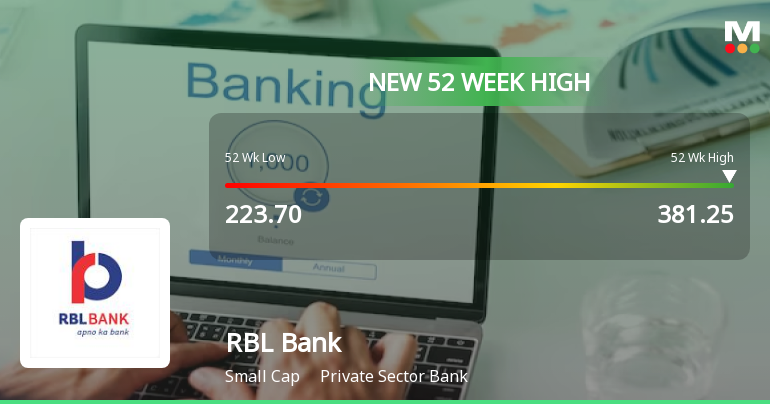
Broad-Based Technical Strength Lifts RBL Bank Ltd to 52-Week High of Rs 381.25
Surging to a fresh 52-week high of Rs 381.25 on 22 Jun 2026, RBL Bank Ltd has demonstrated remarkable price momentum, outpacing the broader market with a 66.35% gain over the past year against the Sensex’s decline of 6.31%. This milestone caps a sustained rally supported by a confluence of bullish technical indicators and improving fundamentals.
Read full news article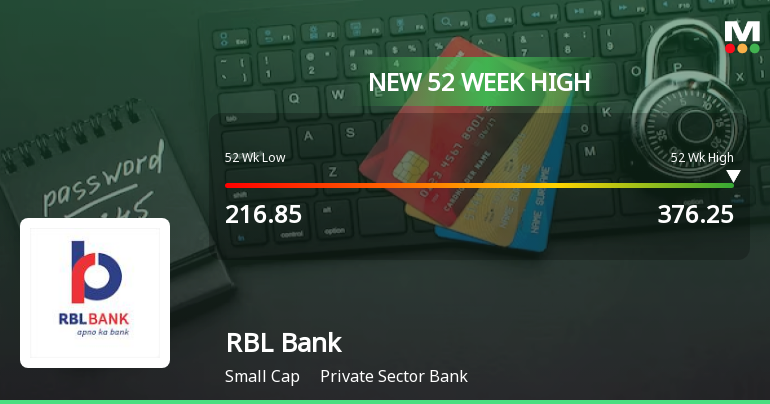
Broad-Based Technical Strength Lifts RBL Bank Ltd to 52-Week High of Rs 376.25
Surging past its previous peak, RBL Bank Ltd touched a fresh 52-week high of Rs 376.25 on 19 Jun 2026, marking a significant milestone in its price momentum. This advance comes amid a backdrop of strong technical signals and sustained outperformance relative to its sector and the broader market.
Read full news article Announcements
Announcement under Regulation 30 (LODR)-Analyst / Investor Meet - Outcome
23-Jun-2026 | Source : BSERBL Bank Limited informs the exchange about Investor/Analyst Meets.
Closure of Trading Window
23-Jun-2026 | Source : BSERBL Bank Limited informs the exchange about Closure of Trading Window.
Announcement under Regulation 30 (LODR)-Credit Rating
22-Jun-2026 | Source : BSERBL Bank Limited informs the exchange about Credit Rating.
Corporate Actions

No Upcoming Board Meetings

RBL Bank Ltd has declared 10% dividend, ex-date: 08 Sep 25

No Splits history available

No Bonus history available

No Rights history available
Quality key factors
Valuation key factors
Technicals key factors
 Technical Indicator Scale: Bearish, Mildly Bearish, Sideways, Mildly Bullish, Bullish Turned
 Shareholding Snapshot : Jun 2026
Shareholding Compare (%holding)
Promoters
None
Held by 41 Schemes (14.89%)
Held by 187 FIIs (7.88%)
None
Quant Mutual Fund - Quant Small Cap Fund (6.13%)
9.25%
Quarterly Results Snapshot (Standalone) - Mar'26 - YoY

YoY Growth in quarter ended Mar 2026 is 7.04% vs 4.09% in Mar 2025
YoY Growth in quarter ended Mar 2026 is 234.37% vs -80.52% in Mar 2025
Half Yearly Results Snapshot (Standalone) - Sep'25

Growth in half year ended Sep 2025 is -1.12% vs 19.84% in Sep 2024
Growth in half year ended Sep 2025 is -36.22% vs 2.04% in Sep 2024
Nine Monthly Results Snapshot (Standalone) - Dec'25
YoY Growth in nine months ended Dec 2025 is 0.49% vs 16.66% in Dec 2024
YoY Growth in nine months ended Dec 2025 is -5.42% vs -23.13% in Dec 2024
Annual Results Snapshot (Standalone) - Mar'26
YoY Growth in year ended Mar 2026 is 2.11% vs 13.27% in Mar 2025
YoY Growth in year ended Mar 2026 is 18.27% vs -40.46% in Mar 2025
About RBL Bank Ltd

Company Coordinates


