Responsive Ind

  • Market Cap: Small Cap
  • Industry: Furniture, Home Furnishing
  • ISIN: INE688D01026
  • NSEID: RESPONIND
  • BSEID: 505509
INR
159.60
-3.75 (-2.3%)
BSENSE

Sep 18, 03:30 PM

BSE+NSE Vol: 2.09 lacs

  • Price Points
  • Score
  • Mojo Parameters
  • Total Return
  • News and Corporate Actions
  • Key factors
  • Shareholding
  • Financials
  • CompanyCV
stock-summaryPrice Point
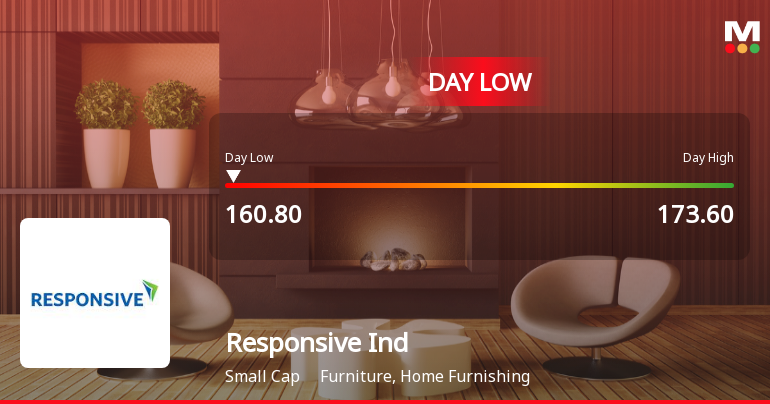
High/Low

1Day

52 Week

Valuation
Technical
Day's Volume

CASH

2.09 lacs (-72.35%) Volume

Shareholding (Jun 2026)

FII

7.48%

Held by 32 FIIs

DII

3.22%

Held by 4 DIIs

Promoter

59.14%

Why is Responsive Industries Ltd falling/rising?

06-Sep-2026

As of 05-Sep, Responsive Industries Ltd's stock price is rising to 155.35, reflecting a short-term gain despite a significant year-to-date decline of 22.31%. The recent increase may not be sustainable due to underlying financial challenges and reduced institutional investor participation.

As of 05-Sep, Responsive Industries Ltd's stock price is rising, currently at 155.35, with a change of 3.15 (2.07%) upwards. This increase can be attributed to several factors. Notably, the stock has been gaining for the last four consecutive days, resulting in a total return of 4.37% during this period. Additionally, it has outperformed its sector by 1.9% today, indicating a relative strength compared to its peers.<BR><BR>The stock also reached an intraday high of Rs 175.9, reflecting a significant increase of 15.57% at one point during the trading day. However, it is important to note that despite this recent rise, the stock has experienced a considerable decline over longer periods, with a year-to-date drop of 22.31% and a 3-year decline of 38.48%. <BR><BR>While the company has a strong ability to service its debt, evidenced by a low Debt to EBITDA ratio of 0.81 times, it faces challenges such as poor long-term growth and negative results over the last four consecutive quarters. The recent positive price movement may not be sustainable given the broader context of its financial performance and the falling participation from institutional investors, who have decreased their stake by 24.72% in the last quarter. <BR><BR>In summary, the stock's current rise is driven by short-term gains and market performance, but it is essential to consider the underlying negative trends that could impact its future stability.

View full answer

Who are in the management team of Responsive Ind?

01-Sep-2026

The management team of Responsive Ind includes Rishab Agarwal (Chairman), Mehul Vala (CEO), Sadanand Morab (Executive Director), and independent directors Mita Jha, Sanjiv Swarup, and Arun Vikram Goel.

The management team of Responsive Ind includes the following individuals:<BR><BR>1. **Rishab Agarwal** - Chairman & Non-Executive Director<BR>2. **Mehul Vala** - Whole Time Director & CEO<BR>3. **Sadanand Morab** - Executive Director<BR>4. **Mita Jha** - Independent Non-Executive Director<BR>5. **Sanjiv Swarup** - Independent Non-Executive Director<BR>6. **Arun Vikram Goel** - Independent Non-Executive Director<BR><BR>If you need more details about their roles or contributions, feel free to ask!

View full answer

What does Responsive Ind do?

01-Sep-2026

Responsive Industries Ltd is a small-cap manufacturer of PVC-based products for the Furniture and Home Furnishing industry, with net sales of ₹193 Cr and a net profit of ₹3 Cr reported for June 2026. The company has a market cap of ₹4,026 Cr and key metrics include a P/E ratio of 39.00 and a dividend yield of 0.13%.

Overview:<BR>Responsive Industries Ltd is a leading manufacturer of polyvinyl chloride (PVC)-based products in the Furniture and Home Furnishing industry, categorized as a Small Cap company.<BR><BR>History:<BR>The company was originally incorporated in July 1982 under the name 'Sinhal Holdings Limited' and later changed its name to 'Responsive Polymers Limited' in January 2006. The most recent quarterly results reported net sales and profit for June 2026.<BR><BR>Financial Snapshot:<BR>- Net Sales: 193 Cr (Quarterly Results - Jun 2026)<BR>- Net Profit: 3 Cr (Quarterly Results - Jun 2026)<BR>- Market cap: INR 4,026 Cr (Small Cap)<BR><BR>Key Metrics:<BR>- P/E: 39.00<BR>- Industry P/E: 34<BR>- Dividend Yield: 0.13%<BR>- Debt Equity: 0.11<BR>- Return on Equity: 9.55%<BR>- Price to Book: 2.62<BR><BR>Contact Details:<BR>Address: Village Betegaon Boisar (East), Mahagaon Road Taluka Palghar Thane Maharashtra : 401501<BR>Tel: 91-022-66562821<BR>Email: investor@responsiveindustries.com<BR>Website: http://www.responsiveindustries.com

View full answer

Who are the peers of the Responsive Ind?

01-Sep-2026

Peers of Responsive Ind include Sheela Foam, BirlaNu Ltd, Stanley Lifestyle, Hardwyn India, Tirupati Foam, Safe Enterprises, and Rexpro Enterprises. Responsive Ind has a good capital structure and a 1-year return of -22.53%, better than Stanley Lifestyle but worse than Tirupati Foam's 37.59%.

Peers: The peers of Responsive Ind are Sheela Foam, BirlaNu Ltd, Stanley Lifesty., Hardwyn India, Tirupati Foam, Safe Enterprises, and Rexpro Enter.<BR><BR>Quality Snapshot: Excellent capital structure is observed at Hardwyn India and Safe Enterprises, while Good capital structure is found at Sheela Foam, Responsive Ind, and Rexpro Enter. Average management risk is noted at Sheela Foam, Responsive Ind, Hardwyn India, and Tirupati Foam, while Below Average management risk is present at BirlaNu Ltd, Stanley Lifesty., and Rexpro Enter. Growth is rated as Excellent for Safe Enterprises, while Below Average growth is seen at Sheela Foam, Responsive Ind, BirlaNu Ltd, Stanley Lifesty., Hardwyn India, Tirupati Foam, and Rexpro Enter.<BR><BR>Return Snapshot: The peer with the highest 1-year return is Tirupati Foam at 37.59%, while the peer with the lowest is Stanley Lifesty. at -54.84%. Responsive Ind's 1-year return is -22.53%, which is better than Stanley Lifesty. but worse than Tirupati Foam. Additionally, Hardwyn India, Stanley Lifesty., and BirlaNu Ltd have negative six-month returns.

View full answer

How big is Responsive Ind?

01-Sep-2026

As of 31st August, Responsive Industries Ltd has a market capitalization of 4,026.00 Cr, with recent Net Sales of 1,248.28 Cr and a Net Profit of 101.30 Cr. Shareholder's Funds were valued at 1,558.93 Cr, and Total Assets amounted to 1,853.44 Cr as of March 2026.

As of 31st August, Responsive Industries Ltd has a market capitalization of 4,026.00 Cr, categorizing it as a Small Cap company.<BR><BR>For the latest four quarters, the company reported Net Sales of 1,248.28 Cr and a Net Profit of 101.30 Cr.<BR><BR>As of March 2026, the Shareholder's Funds were valued at 1,558.93 Cr, while the Total Assets amounted to 1,853.44 Cr.

View full answer

Should I buy, sell or hold Responsive Industries Ltd?

18-Aug-2026

Are Responsive Industries Ltd latest results good or bad?

27-May-2026

Responsive Industries Ltd's latest results show a significant decline in net profit by 57.94% year-on-year, despite a 13.05% increase in net sales. Overall, the company's profitability is under pressure due to falling margins and rising interest expenses, indicating more challenges than positives.

The latest results for Responsive Industries Ltd present a mixed picture, but overall, they indicate significant challenges. <BR><BR>In Q4 FY26, the company reported a net profit of ₹22.82 crores, which is a substantial decline of 57.94% year-on-year. Although there was a slight sequential improvement of 1.51%, this is overshadowed by the drastic drop compared to the previous year. On the other hand, net sales reached ₹430.34 crores, marking a robust 13.05% increase year-on-year and the highest quarterly revenue recorded by the company.<BR><BR>However, this revenue growth did not translate into improved profitability. The operating margin (excluding other income) fell sharply to 10.77%, down from 20.72% a year earlier, indicating severe margin compression. The profit after tax (PAT) margin also nearly halved, dropping to 5.30% from 14.25% in the previous year.<BR><BR>The financial performance reflects operational challenges that have significantly impacted the company's profitability profile. Rising interest expenses and a record low interest coverage ratio further exacerbate concerns about the company's ability to manage its debt effectively.<BR><BR>In summary, while the revenue growth is a positive sign, the drastic decline in net profit and margins suggests that the company's operational health is under significant pressure, making the latest results more concerning than encouraging.

View full answer

When is the next results date for Responsive Industries Ltd?

19-May-2026

The next results date for Responsive Industries Ltd is 26 May 2026.

The next results date for Responsive Industries Ltd is scheduled for 26 May 2026.

View full answer

Is Responsive Ind technically bullish or bearish?

03-Dec-2025

As of December 2, 2025, the market trend is neutral with mixed signals, showing mildly bullish indicators on the weekly MACD and KST, while the monthly indicators are bearish, resulting in a lack of strong directional momentum.

As of 2 December 2025, the technical trend has changed from mildly bearish to sideways. The current stance is neutral, with mixed signals across different time frames. The weekly MACD and KST indicate a mildly bullish outlook, while the monthly MACD and KST are bearish. The Bollinger Bands show a bullish signal on the weekly chart but are mildly bearish on the monthly. Daily moving averages are mildly bearish, which contrasts with the overall bullish signals from the OBV on both weekly and monthly charts. The Dow Theory supports a mildly bullish stance on both weekly and monthly time frames. Overall, the indicators suggest a lack of strong directional momentum, resulting in a neutral position.

View full answer

How has been the historical performance of Responsive Ind?

02-Dec-2025

Responsive Ind has shown significant growth in net sales and profitability, with net sales increasing from 973.66 Cr in March 2023 to 1,417.91 Cr in March 2025, and profit after tax rising from 24.44 Cr to 198.86 Cr during the same period. The company also experienced a balanced growth in total assets and liabilities, alongside improved cash flow from operating activities.

Answer:<BR>The historical performance of Responsive Ind shows a significant upward trend in net sales and profitability over the years, culminating in the fiscal year ending March 2025.<BR><BR>Breakdown:<BR>Responsive Ind's net sales have increased from 973.66 Cr in March 2023 to 1,417.91 Cr in March 2025, reflecting a strong growth trajectory. The total operating income followed a similar pattern, rising from 973.66 Cr in March 2023 to 1,417.91 Cr in March 2025. Despite fluctuations in raw material costs and other expenses, the total expenditure (excluding depreciation) also rose, reaching 1,122.91 Cr in March 2025. Operating profit, excluding other income, saw a notable increase to 295.00 Cr in March 2025 from 109.98 Cr in March 2023. Profit before tax surged to 209.78 Cr in March 2025, compared to just 28.43 Cr in March 2023, leading to a profit after tax of 198.86 Cr in March 2025, up from 24.44 Cr in March 2023. The company's total assets grew to 1,737.88 Cr in March 2025, while total liabilities also increased to 1,737.88 Cr, indicating a balanced growth. Cash flow from operating activities improved significantly to 75.00 Cr in March 2025, although the net cash outflow was recorded at -8.00 Cr. Overall, Responsive Ind has demonstrated robust growth in sales and profitability, alongside a steady increase in assets and liabilities over the observed period.

View full answer

Is Responsive Ind overvalued or undervalued?

27-Nov-2025

As of November 26, 2025, Responsive Ind is considered very expensive and overvalued with a PE ratio of 27.73, compared to its fairly valued peer Finolex Inds at 23.9 and attractive peer Time Technoplast at 23.76, despite having strong short-term returns but a year-to-date performance of -14.56% versus the Sensex's 9.56%.

As of 26 November 2025, the valuation grade for Responsive Ind has moved from expensive to very expensive, indicating a significant shift in its perceived value. The company is currently considered overvalued. Key ratios include a PE ratio of 27.73, an EV to EBITDA of 19.45, and a PEG ratio of 3.24, all of which suggest a premium valuation compared to its peers.<BR><BR>In comparison, Finolex Inds, which is fairly valued, has a PE ratio of 23.9, while Time Technoplast, rated attractive, has a PE ratio of 23.76. The stark contrast in valuation metrics highlights the overvaluation of Responsive Ind relative to its industry peers. Additionally, while Responsive Ind has shown strong short-term returns, outperforming the Sensex over the last week and month, its longer-term performance has lagged, with a year-to-date return of -14.56% compared to the Sensex's 9.56%.

View full answer

Who are the top shareholders of the Responsive Ind?

17-Jul-2025

The top shareholders of Responsive Ind are Wellknown Business Ventures LLP with 47.51%, followed by foreign institutional investors holding 31.62%, Fossebridge Limited at 12.66%, and individual investors with 3.86%.

The top shareholders of Responsive Ind include the promoters, who hold the majority of the shares. The promoter with the highest holding is Wellknown Business Ventures LLP, which owns 47.51% of the company. Additionally, foreign institutional investors (FIIs) hold a significant portion, with 31.62% of the shares distributed among 35 different FIIs. The highest public shareholder is Fossebridge Limited, holding 12.66%. Individual investors collectively own 3.86% of the company.

View full answer

What is the bonus history of the Responsive Ind?

06-Jun-2025

Responsive Industries Ltd has a bonus history that includes a 3:1 bonus issue announced on March 22, 2007, with a record date of April 5, 2007, allowing shareholders to receive three additional shares for every one share held.

Responsive Industries Ltd has a bonus history that includes a significant bonus issue announced as a 3:1 ratio. This bonus was declared with an ex-date of March 22, 2007, and the record date was April 5, 2007. This means that shareholders on record as of the record date were entitled to receive three additional shares for every one share they held.

View full answer

Has Responsive Ind declared dividend?

06-Jun-2025

Responsive Industries Ltd has declared a 10% dividend, amounting to 0.1 per share, with an ex-date of September 6, 2024. Recent total returns show volatility, with negative returns over the last 6 months and 1 year, but positive trends over longer periods, particularly a 171.65% total return over the past 5 years.

Responsive Industries Ltd has declared a 10% dividend.<BR><BR>Dividend Details:<BR>- Percentage announced: 10%<BR>- Amount per share: 0.1<BR>- Ex-date: 06 Sep 24<BR><BR>Dividend Yield: 0.05%.<BR><BR>Total Returns by Period:<BR>Over the last 6 months, the price return was -23.28%, with a dividend return of 0%, resulting in a total return of -23.28%.<BR><BR>In the past year, the price return was -34.36%, the dividend return was 0.03%, leading to a total return of -34.33%.<BR><BR>Over 2 years, the price return was 30.89%, the dividend return was 0.12%, culminating in a total return of 31.01%.<BR><BR>For the 3-year period, the price return was 48.04%, the dividend return was 0.27%, resulting in a total return of 48.31%.<BR><BR>In the last 4 years, the price return was 38.73%, the dividend return was 0.27%, giving a total return of 39.0%.<BR><BR>Over the past 5 years, the price return was 171.07%, with a dividend return of 0.58%, leading to a total return of 171.65%.<BR><BR>Overall, while Responsive Industries Ltd has declared a dividend, the recent total returns indicate significant volatility, particularly in the short term, with negative returns over the last 6 months and 1 year. However, the longer-term returns show a positive trend, especially over the 5-year period.

View full answer
iScoreScore
Click here to find our call on this stock
Strong Sell
Sell
Hold
Buy
Strong Buy

Dashboard

1

Poor long term growth as Net Sales has grown by an annual rate of 9.92% and Operating profit at 16.16% over the last 5 years

 
2

With a fall in Operating Profit of -48.4%, the company declared Very Negative results in Jun 26

3

With ROCE of 9.8, it has a Expensive valuation with a 2.6 Enterprise value to Capital Employed

4

Falling Participation by Institutional Investors

stock-summaryMojo Parameters

Mojo Parameters

Loading Valuation Snapshot...

Stock DNA

stock-summary
Industry

Furniture, Home Furnishing

stock-summary
Market cap

INR 4,263 Cr (Small Cap)

stock-summary
P/E

42.00

stock-summary
Industry P/E

32

stock-summary
Dividend Yield

0.06%

stock-summary
Debt Equity

0.11

stock-summary
Return on Equity

9.55%

stock-summary
Price to Book

2.78

Revenue and Profits:
Net Sales:
193 Cr
(Quarterly Results - Jun 2026)
Net Profit:
3 Cr
stock-summaryTotal Returns
Total Returns (Price + Dividend) stock-summary
Dividend Yield (0.06%)
TimePeriod
Price Return
Dividend Return
Total Return
3 Months
-14.17%
0.05%
-14.12%
6 Months
1.01%
0.07%
1.08%
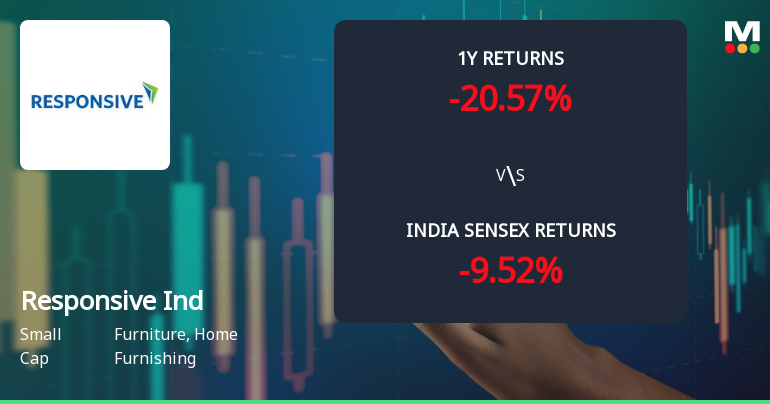
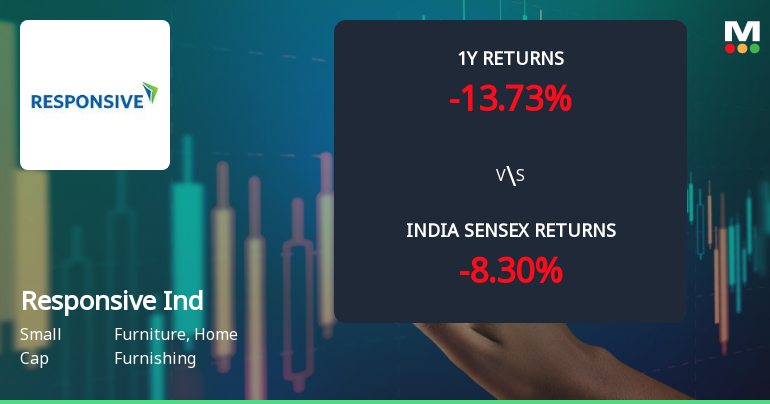
1 Year
-20.64%
0.05%
-20.59%
2 Years
-45.21%
0.07%
-45.14%
3 Years
-51.68%
0.09%
-51.59%
4 Years
8.61%
0.28%
8.89%
5 Years
27.12%
0.40%
27.52%

Latest dividend: 0.10081917475728155 per share ex-dividend date: Aug-14-2026

Risk Adjusted Returns v/s stock-summary
Returns Beta
Icon
Beta has not been calculated since enough price history is not available
stock-summaryNews & Corporate Actions

Announcements stock-summary

Board Meeting Outcome for Outcome Of Board Meeting Held On September 17 2026

17-Sep-2026 | Source : BSE

Outcome of Board Meeting held on September 17 2026

Board Meeting Intimation for Considering The Proposal Of Buy-Back Of Equity Shares Of The Company

10-Sep-2026 | Source : BSE

Responsive Industries Ltdhas informed BSE that the meeting of the Board of Directors of the Company is scheduled on 17/09/2026 inter alia to consider and approve to consider the proposal of buy-back of equity shares of the Company

Disclosure Under Regulation 31(1) Of The SEBI (SAST) Regulations 2011 & Regulation 7(2) Of The SEBI (Prohibition Of Insider Trading) Regulations 2015

01-Sep-2026 | Source : BSE

Please find attached disclosure as mentioned

Corporate Actions stock-summary

stock-summary
BOARD MEETING

No Upcoming Board Meetings

stock-summary
DIVIDEND

Responsive Industries Ltd has declared 10% dividend, ex-date: 14 Aug 26

stock-summary
SPLITS

Responsive Industries Ltd has announced 1:10 stock split, ex-date: 08 Oct 10

stock-summary
BONUS

Responsive Industries Ltd has announced 3:1 bonus issue, ex-date: 22 Mar 07

stock-summary
RIGHTS

No Rights history available

stock-summaryKey Factors

Quality key factors stock-summary

Factor
Value
Sales Growth (5y)
9.92%
EBIT Growth (5y)
16.16%
EBIT to Interest (avg)
5.21
Debt to EBITDA (avg)
1.27
Net Debt to Equity (avg)
0.11
Sales to Capital Employed (avg)
0.81
Tax Ratio
4.78%
Dividend Payout Ratio
1.34%
Pledged Shares
5.65%
Institutional Holding
10.70%
ROCE (avg)
9.09%
ROE (avg)
8.19%

Valuation key factors

Factor
Value
P/E Ratio
42
Industry P/E
32
Price to Book Value
2.74
EV to EBIT
36.66
EV to EBITDA
23.11
EV to Capital Employed
2.56
EV to Sales
3.56
PEG Ratio
NA
Dividend Yield
0.06%
ROCE (Latest)
9.83%
ROE (Latest)
9.55%

Technicals key factors

Indicator
Weekly
Monthly
MACD
Bearish
Bearish
RSI
No Signal
No Signal
Bollinger Bands
Bearish
Mildly Bearish
Moving Averages
Bearish (Daily)
KST
Bearish
Bearish
Dow Theory
No Trend
Mildly Bearish
OBV
No Trend
Bullish
stock-summary Technical Indicator Scale: Bearish, Mildly Bearish, Sideways, Mildly Bullish, Bullish  Turned 
stock-summaryShareholding
Shareholding Snapshot : Jun 2026stock-summary
Shareholding Compare (%holding) stock-summary
Majority shareholders

Promoters

Pledged Promoter Holdings

5.6466

Mutual Funds

Held by 1 Schemes (0.0%)

FIIs

Held by 32 FIIs (7.48%)

Promoter with highest holding

Wellknown Business Ventures Llp (47.51%)

Highest Public shareholder

Fossebridge Limited (12.32%)

Individual Investors Holdings

3.61%

stock-summaryFinancial
[
  {
    "link": "quarterly",
    "btn_text": "All Quarterly Results",
    "header": "Quarterly Results Snapshot (Consolidated) - Jun'26 - QoQ",
    "rhs": [
      {
        "prefix": "Net Sales ",
        "suffix": "QoQ Growth in quarter ended Jun 2026 is -55.18% vs 38.23% in Mar 2026",
        "dir": -1
      },
      {
        "prefix": "Consolidated Net Profit ",
        "suffix": "QoQ Growth in quarter ended Jun 2026 is -87.99% vs 1.51% in Mar 2026",
        "dir": -1
      }
    ],
    "table": {
      "header": [
        "Jun'26",
        "Mar'26",
        "Change(%)"
      ],
      "body": [
        {
          "field": "Net Sales",
          "val1": "192.87",
          "val2": "430.34",
          "chgp": "-55.18%",
          "chgp_class": "negative"
        },
        {
          "field": "Operating Profit (PBDIT) excl Other Income",
          "val1": "23.31",
          "val2": "46.36",
          "chgp": "-49.72%",
          "chgp_class": "negative"
        },
        {
          "field": "Interest",
          "val1": "4.00",
          "val2": "7.69",
          "chgp": "-47.98%",
          "chgp_class": "positive"
        },
        {
          "field": "Exceptional Items",
          "val1": "0.00",
          "val2": "0.00",
          "chgp": "",
          "chgp_class": "neutral"
        },
        {
          "field": "Consolidate Net Profit",
          "val1": "2.74",
          "val2": "22.82",
          "chgp": "-87.99%",
          "chgp_class": "negative"
        },
        {
          "field": "Operating Profit Margin (Excl OI)",
          "val1": "12.09%",
          "val2": "10.77%",
          "chgp": "1.32%",
          "chgp_class": "positive"
        }
      ]
    }
  },
  {
    "link": "half-yearly",
    "btn_text": "All Half Yearly Results",
    "header": "Half Yearly Results Snapshot (Consolidated) - Sep'25",
    "rhs": [
      {
        "prefix": "Net Sales ",
        "suffix": " Growth in half year ended Sep 2025 is -2.53% vs 25.95% in Sep 2024",
        "dir": -1
      },
      {
        "prefix": "Consolidated Net Profit ",
        "suffix": " Growth in half year ended Sep 2025 is 5.60% vs 40.11% in Sep 2024",
        "dir": -1
      }
    ],
    "table": {
      "header": [
        "Sep'25",
        "Sep'24",
        "Change(%)"
      ],
      "body": [
        {
          "field": "Net Sales",
          "val1": "652.46",
          "val2": "669.43",
          "chgp": "-2.53%",
          "chgp_class": "negative"
        },
        {
          "field": "Operating Profit (PBDIT) excl Other Income",
          "val1": "149.18",
          "val2": "143.79",
          "chgp": "3.75%",
          "chgp_class": "positive"
        },
        {
          "field": "Interest",
          "val1": "12.36",
          "val2": "10.45",
          "chgp": "18.28%",
          "chgp_class": "negative"
        },
        {
          "field": "Exceptional Items",
          "val1": "0.00",
          "val2": "0.00",
          "chgp": "",
          "chgp_class": "neutral"
        },
        {
          "field": "Consolidate Net Profit",
          "val1": "103.13",
          "val2": "97.66",
          "chgp": "5.60%",
          "chgp_class": "positive"
        },
        {
          "field": "Operating Profit Margin (Excl OI)",
          "val1": "22.86%",
          "val2": "21.48%",
          "chgp": "1.38%",
          "chgp_class": "positive"
        }
      ]
    }
  },
  {
    "link": "nine-monthly",
    "btn_text": "All Nine Monthly Results",
    "header": "Nine Monthly Results Snapshot (Consolidated) - Dec'25",
    "rhs": [
      {
        "prefix": "Net Sales ",
        "suffix": "YoY Growth in nine months ended Dec 2025 is -7.08% vs 29.85% in Dec 2024",
        "dir": -1
      },
      {
        "prefix": "Consolidated Net Profit ",
        "suffix": "YoY Growth in nine months ended Dec 2025 is -13.14% vs 26.40% in Dec 2024",
        "dir": -1
      }
    ],
    "table": {
      "header": [
        "Dec'25",
        "Dec'24",
        "Change(%)"
      ],
      "body": [
        {
          "field": "Net Sales",
          "val1": "963.78",
          "val2": "1,037.25",
          "chgp": "-7.08%",
          "chgp_class": "negative"
        },
        {
          "field": "Operating Profit (PBDIT) excl Other Income",
          "val1": "195.40",
          "val2": "216.13",
          "chgp": "-9.59%",
          "chgp_class": "negative"
        },
        {
          "field": "Interest",
          "val1": "18.03",
          "val2": "17.08",
          "chgp": "5.56%",
          "chgp_class": "negative"
        },
        {
          "field": "Exceptional Items",
          "val1": "-0.54",
          "val2": "0.00",
          "chgp": "",
          "chgp_class": "neutral"
        },
        {
          "field": "Consolidate Net Profit",
          "val1": "125.61",
          "val2": "144.61",
          "chgp": "-13.14%",
          "chgp_class": "negative"
        },
        {
          "field": "Operating Profit Margin (Excl OI)",
          "val1": "20.27%",
          "val2": "20.84%",
          "chgp": "-0.57%",
          "chgp_class": "negative"
        }
      ]
    }
  },
  {
    "link": "annual",
    "btn_text": "All Annual Results",
    "header": "Annual Results Snapshot (Consolidated) - Mar'26",
    "rhs": [
      {
        "prefix": "Net Sales ",
        "suffix": "YoY Growth in year ended Mar 2026 is -1.68% vs 30.45% in Mar 2025",
        "dir": -1
      },
      {
        "prefix": "Consolidated Net Profit ",
        "suffix": "YoY Growth in year ended Mar 2026 is -25.36% vs 23.31% in Mar 2025",
        "dir": -1
      }
    ],
    "table": {
      "header": [
        "Mar'26",
        "Mar'25",
        "Change(%)"
      ],
      "body": [
        {
          "field": "Net Sales",
          "val1": "1,394.12",
          "val2": "1,417.91",
          "chgp": "-1.68%",
          "chgp_class": "negative"
        },
        {
          "field": "Operating Profit (PBDIT) excl Other Income",
          "val1": "241.77",
          "val2": "295.00",
          "chgp": "-18.04%",
          "chgp_class": "negative"
        },
        {
          "field": "Interest",
          "val1": "25.72",
          "val2": "23.96",
          "chgp": "7.35%",
          "chgp_class": "negative"
        },
        {
          "field": "Exceptional Items",
          "val1": "-0.54",
          "val2": "0.00",
          "chgp": "",
          "chgp_class": "neutral"
        },
        {
          "field": "Consolidate Net Profit",
          "val1": "148.43",
          "val2": "198.86",
          "chgp": "-25.36%",
          "chgp_class": "negative"
        },
        {
          "field": "Operating Profit Margin (Excl OI)",
          "val1": "17.34%",
          "val2": "20.81%",
          "chgp": "-3.47%",
          "chgp_class": "negative"
        }
      ]
    }
  }
]

Quarterly Results Snapshot (Consolidated) - Jun'26 - QoQstock-summary

Jun'26
Mar'26
Change(%)
Net Sales
192.87
430.34
-55.18%
Operating Profit (PBDIT) excl Other Income
23.31
46.36
-49.72%
Interest
4.00
7.69
-47.98%
Exceptional Items
0.00
0.00
Consolidate Net Profit
2.74
22.82
-87.99%
Operating Profit Margin (Excl OI)
12.09%
10.77%
1.32%
Values in Rs Cr.
Direction Arrows
Net Sales

QoQ Growth in quarter ended Jun 2026 is -55.18% vs 38.23% in Mar 2026

Direction Arrows
Consolidated Net Profit

QoQ Growth in quarter ended Jun 2026 is -87.99% vs 1.51% in Mar 2026

Half Yearly Results Snapshot (Consolidated) - Sep'25stock-summary

Sep'25
Sep'24
Change(%)
Net Sales
652.46
669.43
-2.53%
Operating Profit (PBDIT) excl Other Income
149.18
143.79
3.75%
Interest
12.36
10.45
18.28%
Exceptional Items
0.00
0.00
Consolidate Net Profit
103.13
97.66
5.60%
Operating Profit Margin (Excl OI)
22.86%
21.48%
1.38%
Values in Rs Cr.
Direction Arrows
Net Sales

Growth in half year ended Sep 2025 is -2.53% vs 25.95% in Sep 2024

Direction Arrows
Consolidated Net Profit

Growth in half year ended Sep 2025 is 5.60% vs 40.11% in Sep 2024

Nine Monthly Results Snapshot (Consolidated) - Dec'25stock-summary

Dec'25
Dec'24
Change(%)
Net Sales
963.78
1,037.25
-7.08%
Operating Profit (PBDIT) excl Other Income
195.40
216.13
-9.59%
Interest
18.03
17.08
5.56%
Exceptional Items
-0.54
0.00
Consolidate Net Profit
125.61
144.61
-13.14%
Operating Profit Margin (Excl OI)
20.27%
20.84%
-0.57%
Values in Rs Cr.
Direction Arrows
Net Sales

YoY Growth in nine months ended Dec 2025 is -7.08% vs 29.85% in Dec 2024

Direction Arrows
Consolidated Net Profit

YoY Growth in nine months ended Dec 2025 is -13.14% vs 26.40% in Dec 2024

Annual Results Snapshot (Consolidated) - Mar'26stock-summary

Mar'26
Mar'25
Change(%)
Net Sales
1,394.12
1,417.91
-1.68%
Operating Profit (PBDIT) excl Other Income
241.77
295.00
-18.04%
Interest
25.72
23.96
7.35%
Exceptional Items
-0.54
0.00
Consolidate Net Profit
148.43
198.86
-25.36%
Operating Profit Margin (Excl OI)
17.34%
20.81%
-3.47%
Values in Rs Cr.
Direction Arrows
Net Sales

YoY Growth in year ended Mar 2026 is -1.68% vs 30.45% in Mar 2025

Direction Arrows
Consolidated Net Profit

YoY Growth in year ended Mar 2026 is -25.36% vs 23.31% in Mar 2025

stock-summaryCompany CV
About Responsive Industries Ltd stock-summary
stock-summary
Responsive Industries Ltd
Small Cap
Furniture, Home Furnishing
Responsive Industries Limited was originally incorporated in July, 1982 under the name 'Sinhal Holdings Limited'. Later on, the Company changed the name from 'Sinhal Holdings Limited' to 'Responsive Polymers Limited' in January, 2006. Company is a leading India-based manufacturer of polyvinyl chloride (PVC)-based products with the product verticals viz.
Company Coordinates stock-summary
Company Details
Village Betegaon Boisar (East), Mahagaon Road Taluka Palghar Thane Maharashtra : 401501
stock-summary
Tel: 91-022-66562821
stock-summary
investor@responsiveindustries.com
Registrar Details
Link Intime India Pvt Ltd, C-13 Pannalal Silk Compound, L B S Marg, Bhandup , Mumbai