
Compare Sanghvi Movers with Similar Stocks
Dashboard
Strong ability to service debt as the company has a low Debt to EBITDA ratio of 1.68 times
Healthy long term growth as Net Sales has grown by an annual rate of 36.90% and Operating profit at 32.87%
Flat results in Mar 26
With ROCE of 15.2, it has a Expensive valuation with a 2.3 Enterprise value to Capital Employed
Despite the size of the company, domestic mutual funds hold only 0.8% of the company
Market Beating performance in long term as well as near term
Total Returns (Price + Dividend) 
Latest dividend: 2 per share ex-dividend date: Sep-12-2025
Risk Adjusted Returns v/s
Returns Beta

News
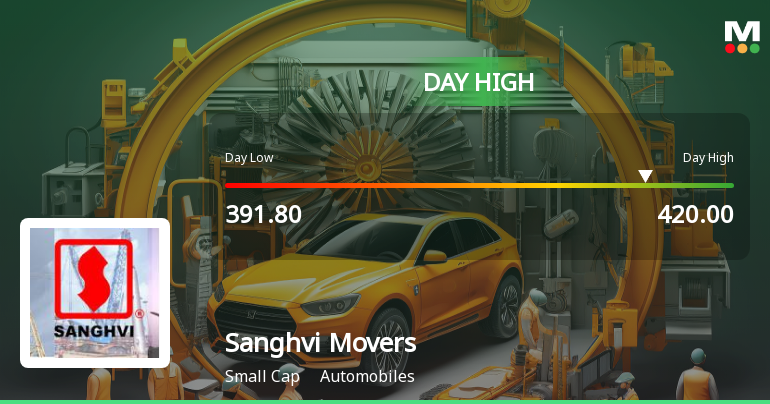
Sanghvi Movers Ltd Surges 7.84% to Day's High of Rs 419.9 — Outperforms Sector by 4.65 Percentage Points
The Sensex advanced 1.52% on 15 Jun 2026, yet Sanghvi Movers Ltd outpaced the broader market with a robust 7.84% gain, reaching an intraday peak of Rs 419.9. This 4.65-percentage-point outperformance over the Engineering sector’s 2.89% rise signals a distinctly stock-specific momentum surge rather than a mere market tailwind.
Read full news article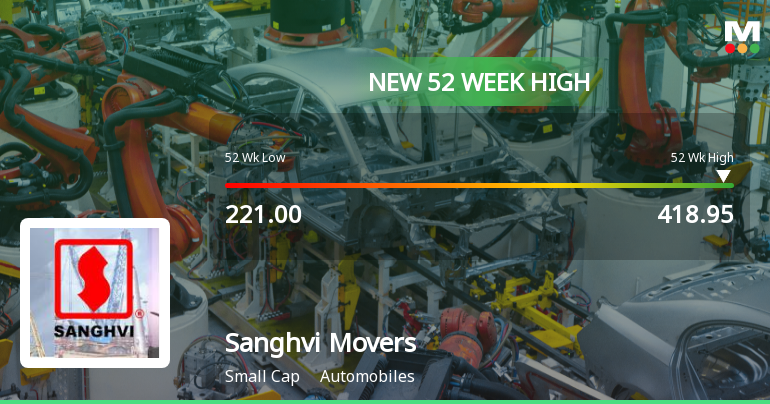
Broad-Based Technical Strength Lifts Sanghvi Movers Ltd to 52-Week High of Rs 418.95
Surging past its previous peaks, Sanghvi Movers Ltd touched a fresh 52-week high of Rs 418.95 on 15 Jun 2026, marking a notable milestone in its price momentum. This rally has been underpinned by a confluence of bullish technical indicators and sustained buying interest, setting the stock apart in the broader automobile sector.
Read full news article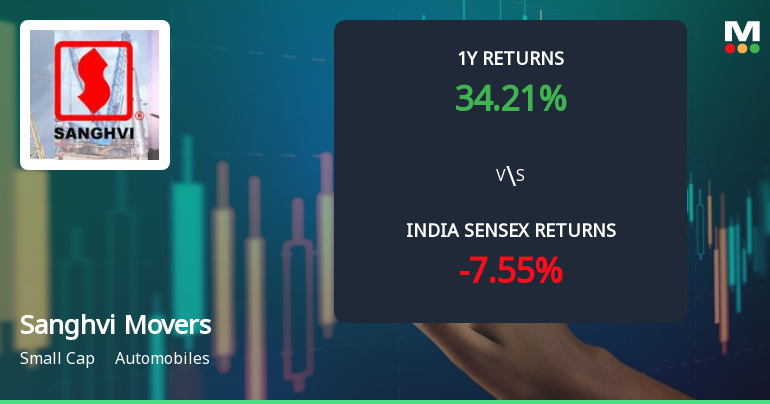
Sanghvi Movers Ltd Sees Bullish Momentum Shift Amid Technical Upgrades
Sanghvi Movers Ltd, a small-cap player in the automobile sector, has witnessed a notable shift in its technical momentum, upgrading from a mildly bullish to a bullish trend. Supported by strong weekly and monthly MACD and Bollinger Bands signals, alongside a daily bullish moving average, the stock has surged 4.64% today, reflecting renewed investor confidence amid broader market volatility.
Read full news article Announcements
Announcement under Regulation 30 (LODR)-Analyst / Investor Meet - Intimation
12-Jun-2026 | Source : BSEIntimation of Schedule of Analyst/Institutional Investors Meet
Announcement under Regulation 30 (LODR)-Analyst / Investor Meet - Intimation
09-Jun-2026 | Source : BSEIntimation of Schedule of Analyst/Institutional Investors Meet
Compliances-Reg.24(A)-Annual Secretarial Compliance
27-May-2026 | Source : BSEAnnual Secretarial Compliance Report for the financial year ended March 31 2026
Corporate Actions

No Upcoming Board Meetings

Sanghvi Movers Ltd has declared 200% dividend, ex-date: 12 Sep 25

Sanghvi Movers Ltd has announced 1:2 stock split, ex-date: 27 Sep 24

No Bonus history available

No Rights history available
Quality key factors
Valuation key factors
Technicals key factors
 Technical Indicator Scale: Bearish, Mildly Bearish, Sideways, Mildly Bullish, Bullish Turned
 Shareholding Snapshot : Mar 2026
Shareholding Compare (%holding)
Non Institution
None
Held by 4 Schemes (0.42%)
Held by 49 FIIs (1.48%)
Rishi Chandrakant Sanghvi (28.82%)
Kedar Dattatraya Borgaonkar (7.21%)
39.71%
Quarterly Results Snapshot (Standalone) - Mar'26 - YoY

YoY Growth in quarter ended Mar 2026 is 26.36% vs -1.89% in Mar 2025
YoY Growth in quarter ended Mar 2026 is 41.50% vs -8.99% in Mar 2025
Half Yearly Results Snapshot (Consolidated) - Sep'25
Growth in half year ended Sep 2025 is 57.55% vs 7.23% in Sep 2024
Growth in half year ended Sep 2025 is 24.31% vs -11.87% in Sep 2024
Nine Monthly Results Snapshot (Consolidated) - Dec'25
YoY Growth in nine months ended Dec 2025 is 39.70% vs 13.60% in Dec 2024
YoY Growth in nine months ended Dec 2025 is 12.47% vs -26.79% in Dec 2024
Annual Results Snapshot (Consolidated) - Mar'26

YoY Growth in year ended Mar 2026 is 36.87% vs 71.60% in Mar 2025
YoY Growth in year ended Mar 2026 is 17.74% vs 39.68% in Mar 2025
About Sanghvi Movers Ltd

Company Coordinates


