
Compare Shadowfax Techno with Similar Stocks
Dashboard
Poor Management Efficiency with a low ROE of 0%
- The company has reported losses. Due to this company has reported negative ROE
The company is Net-Debt Free
Healthy long term growth as Net Sales has grown by an annual rate of 0% and Operating profit at 0%
With ROE of 6.6, it has a Very Expensive valuation with a 7.4 Price to Book Value
High Institutional Holdings at 27.88%
Stock DNA
Transport Services
INR 12,614 Cr (Small Cap)
138.00
39
0.00%
-0.45
6.59%
7.26
Total Returns (Price + Dividend) 
Shadowfax Techno for the last several years.
Risk Adjusted Returns v/s
Returns Beta

News
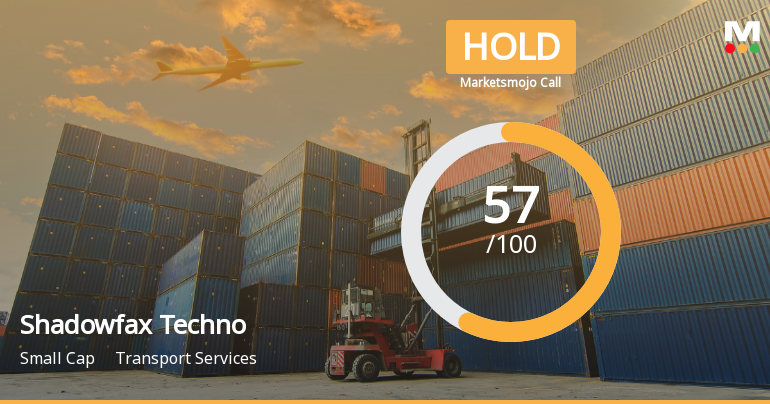
Shadowfax Technologies Ltd Upgraded to Hold by MarketsMOJO on Technical Improvements
Shadowfax Technologies Ltd has seen its investment rating upgraded from Sell to Hold, reflecting a notable improvement in its technical outlook and financial performance. The transport services company’s recent quarterly results, combined with a shift in market sentiment and technical indicators, have contributed to this reassessment by analysts.
Read full news article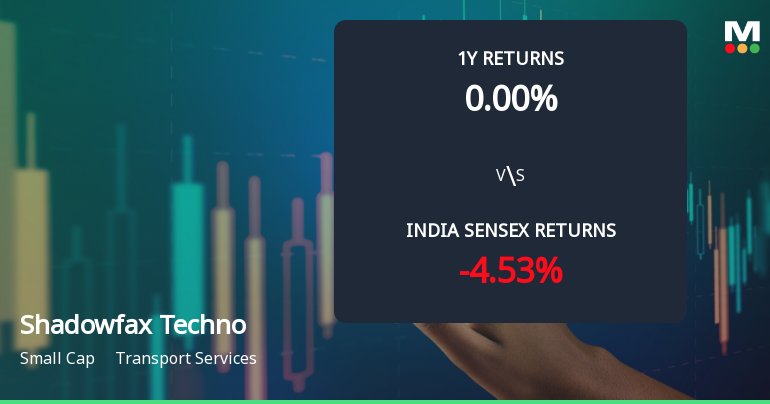
Shadowfax Technologies Ltd Technical Momentum Shifts to Mildly Bullish Amid Market Volatility
Shadowfax Technologies Ltd, a small-cap player in the transport services sector, has exhibited a notable shift in technical momentum, moving from a sideways trend to a mildly bullish stance. This change is underscored by a 4.27% gain in the latest trading session, signalling renewed investor interest despite mixed longer-term returns compared to the broader Sensex.
Read full news article Announcements
Disclosures under Reg. 29(2) of SEBI (SAST) Regulations 2011
28-Jul-2026 | Source : BSEThe Exchange has received the disclosure under Regulation 29(2) of SEBI (Substantial Acquisition of Shares & Takeovers) Regulations 2011 for ICICI Prudential Mutual Fund
Disclosures under Reg. 29(2) of SEBI (SAST) Regulations 2011
28-Jul-2026 | Source : BSEThe Exchange has received the disclosure under Regulation 29(2) of SEBI (Substantial Acquisition of Shares & Takeovers) Regulations 2011 for Eight Roads Investments Mauritius II Ltd
Disclosures under Reg. 29(2) of SEBI (SAST) Regulations 2011
28-Jul-2026 | Source : BSEThe Exchange has received the disclosure under Regulation 29(2) of SEBI (Substantial Acquisition of Shares & Takeovers) Regulations 2011 for Flipkart Internet Pvt Ltd
Corporate Actions

31 Jul 2026

No Dividend history available

No Splits history available

No Bonus history available

No Rights history available
Quality key factors
Valuation key factors
Technicals key factors
 Technical Indicator Scale: Bearish, Mildly Bearish, Sideways, Mildly Bullish, Bullish Turned
 Shareholding Snapshot : Jun 2026
Shareholding Compare (%holding)
Non Institution
None
Held by 12 Schemes (14.11%)
Held by 40 FIIs (8.78%)
Abhishek Bansal (9.28%)
Newquest Asia Fund Iv Singapore Pte Ltd (11.53%)
8.44%
Quarterly Results Snapshot (Standalone) - Mar'26 - QoQ

QoQ Growth in quarter ended Mar 2026 is 6.88% vs 18.69% in Dec 2025
QoQ Growth in quarter ended Mar 2026 is 51.30% vs 156.71% in Dec 2025
Half Yearly Results Snapshot (Consolidated) - Sep'25
Not Applicable: The company has declared_date for only one period
Not Applicable: The company has declared_date for only one period
Nine Monthly Results Snapshot (Consolidated) - Dec'25
Not Applicable: The company has declared_date for only one period
Not Applicable: The company has declared_date for only one period
Annual Results Snapshot (Consolidated) - Mar'26

YoY Growth in year ended Mar 2026 is 69.10% vs 31.85% in Mar 2025
YoY Growth in year ended Mar 2026 is 1,637.33% vs 154.12% in Mar 2025
About Shadowfax Technologies Ltd

Company Coordinates


