
Compare Tata Power Co. with Similar Stocks
Dashboard
Low ability to service debt as the company has a high Debt to EBITDA ratio of 5.81 times
- Low ability to service debt as the company has a high Debt to EBITDA ratio of 5.81 times
- The company has been able to generate a Return on Capital Employed (avg) of 8.28% signifying low profitability per unit of total capital (equity and debt)
Healthy long term growth as Net Sales has grown by an annual rate of 13.97%
Flat results in Mar 26
With ROCE of 8.2, it has a Fair valuation with a 1.9 Enterprise value to Capital Employed
High Institutional Holdings at 28.33%
Total Returns (Price + Dividend) 
Latest dividend: 2.25 per share ex-dividend date: Jun-20-2025
Risk Adjusted Returns v/s
Returns Beta

News

Tata Power Company Ltd is Rated Hold
Tata Power Company Ltd is rated 'Hold' by MarketsMOJO, with this rating last updated on 12 May 2026. However, the analysis and financial metrics discussed here reflect the stock's current position as of 19 June 2026, providing investors with an up-to-date view of the company’s fundamentals, valuation, financial trends, and technical outlook.
Read full news article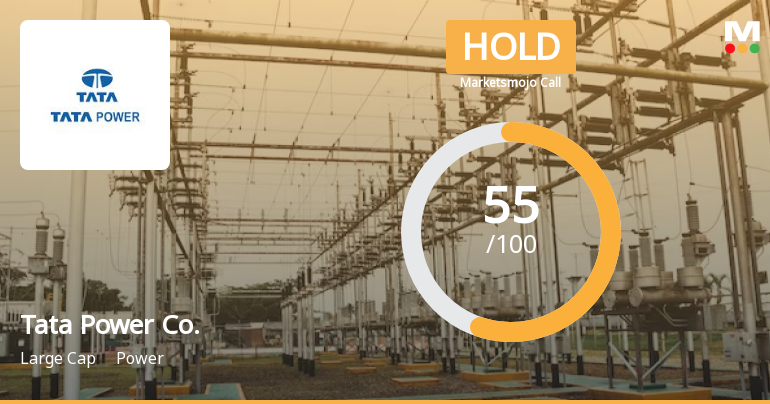
Tata Power Company Ltd is Rated Hold
Tata Power Company Ltd is rated 'Hold' by MarketsMOJO, with this rating last updated on 12 May 2026. However, the analysis and financial metrics discussed here reflect the stock's current position as of 08 June 2026, providing investors with an up-to-date perspective on the company’s fundamentals, valuation, financial trends, and technical outlook.
Read full news article
Tata Power Company Ltd is Rated Hold
Tata Power Company Ltd is rated 'Hold' by MarketsMOJO, with this rating last updated on 12 May 2026. However, the analysis and financial metrics discussed here reflect the stock's current position as of 08 June 2026, providing investors with the latest insights into its performance and outlook.
Read full news article Announcements
Announcement under Regulation 30 (LODR)-Analyst / Investor Meet - Intimation
19-Jun-2026 | Source : BSEWe wish to hereby inform you that Company will be attending one-to-one physical meeting with institutional investors in Singapore scheduled to be held on Thursday June 25 2026.
Announcement under Regulation 30 (LODR)-Award_of_Order_Receipt_of_Order
19-Jun-2026 | Source : BSEBagging of Contract
Announcement under Regulation 30 (LODR)-Newspaper Publication
19-Jun-2026 | Source : BSENewspaper Publication
Corporate Actions

No Upcoming Board Meetings

Tata Power Company Ltd has declared 250% dividend, ex-date: 23 Jun 26

Tata Power Company Ltd has announced 1:10 stock split, ex-date: 26 Sep 11

No Bonus history available

Tata Power Company Ltd has announced 7:50 rights issue, ex-date: 19 Mar 14
Quality key factors
Valuation key factors
Technicals key factors
 Technical Indicator Scale: Bearish, Mildly Bearish, Sideways, Mildly Bullish, Bullish Turned
 Shareholding Snapshot : Mar 2026
Shareholding Compare (%holding)
Promoters
None
Held by 46 Schemes (9.15%)
Held by 429 FIIs (10.04%)
Tata Sons Private Limited (45.21%)
Life Insurance Corporation Of India (5.18%)
21.54%
Quarterly Results Snapshot (Consolidated) - Mar'26 - QoQ

QoQ Growth in quarter ended Mar 2026 is 6.82% vs -10.27% in Dec 2025
QoQ Growth in quarter ended Mar 2026 is 29.01% vs -16.04% in Dec 2025
Half Yearly Results Snapshot (Consolidated) - Sep'25

Growth in half year ended Sep 2025 is 1.78% vs 6.59% in Sep 2024
Growth in half year ended Sep 2025 is 4.31% vs 2.67% in Sep 2024
Nine Monthly Results Snapshot (Consolidated) - Dec'25
YoY Growth in nine months ended Dec 2025 is -1.77% vs 6.10% in Dec 2024
YoY Growth in nine months ended Dec 2025 is -6.04% vs 4.54% in Dec 2024
Annual Results Snapshot (Consolidated) - Mar'26
YoY Growth in year ended Mar 2026 is -4.66% vs 6.56% in Mar 2025
YoY Growth in year ended Mar 2026 is -5.64% vs 7.43% in Mar 2025
About Tata Power Company Ltd

Company Coordinates


